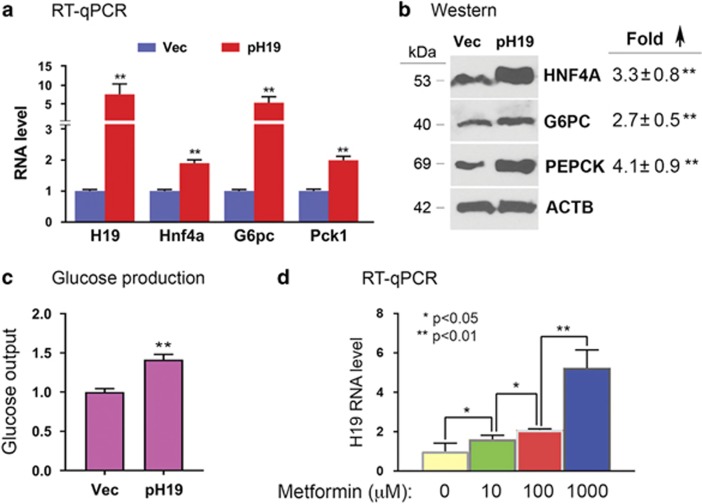
Figure 3.
H19 overexpression and metformin treatment in Huh7 cells. (a and b) Huh7 cells were transfected with Vec or pH19. RNA (a) and protein (b) were isolated at 24 and 48 h post transfection, respectively, and levels were determined. In (b), representative gel images from three independent western blot experiments are shown, with fold increase in pH19-transfected compared to Vec-transfected cells marked on the right. Numbers are mean±S.D. (n=3). **P<0.01. The molecular weights of the proteins are indicated on the left. (c) Huh7 cells were transfected with Vec or pH19. Glucose output assays were carried out at 48 h post transfection. Numbers are mean±S.D. (n=3). **P<0.01. (d) Huh7 cells were treated with metformin at the indicated concentrations for 48 h. RT-qPCR results show increased expression of H19 in a dose-dependent manner. Numbers are mean±S.D. (n=3). P-values are indicated

