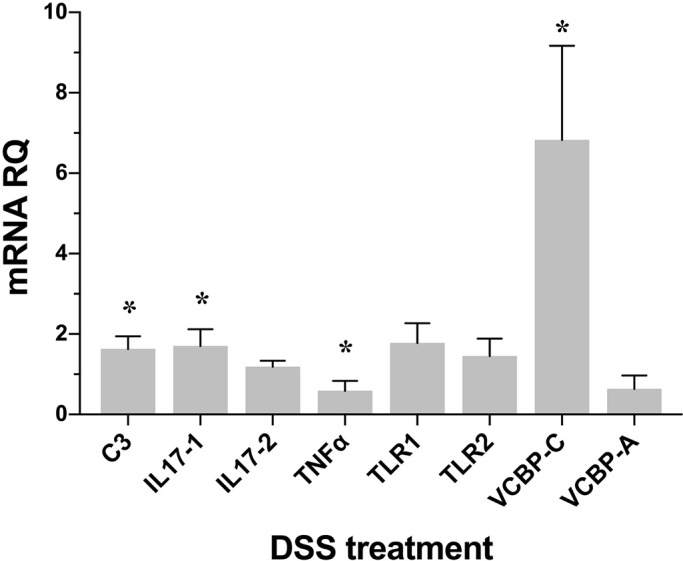
Fig. 6.

Expression levels of immune genes following DSS treatment. Changes in the expression of: C3, IL-17-1, IL-17-2, TNFα, TLR1, TLR2, VCBP-A and VCBP-C in stage 7/8 of the 1st ascidian juvenile treated with 0.05% DSS are measured by qPCR. Expression levels are reported as fold changes of relative RNA quantification (RQ) compared to the corresponding control samples. Vertical bars represent the mean±s.d. (n=3, biological replicates). Statistical methods: independent samples t-test. Asterisk indicates P value <0.05.
