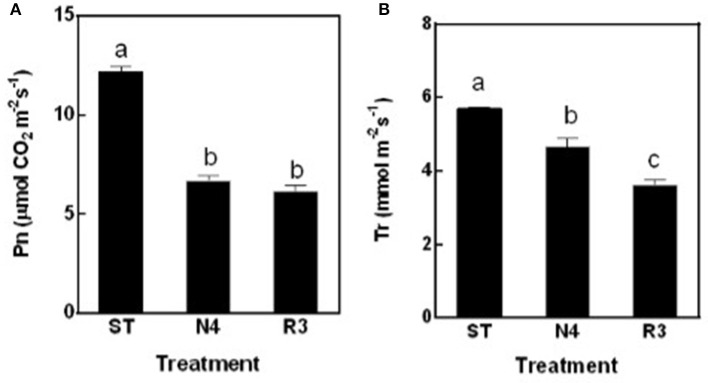
Figure 3.
The net photosynthesis rate (Pn) (A) and transpiration rate (Tr) (B) of peanut leaves were measured in ST, N4, R3, and N7 conditions. Values are means ± SE from at least three independent biological replicates and different letters above the bars indicate significant difference at p < 0.05 as determined by one-way ANOVA followed by Tukey's test.

