Figure 4.
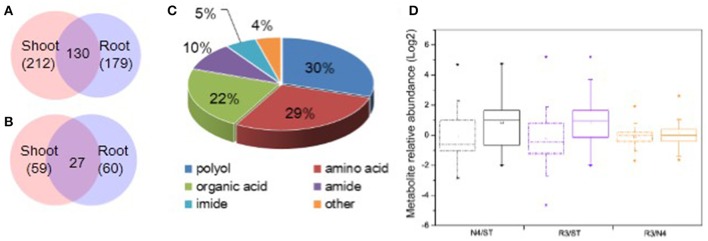
Categorization and variation of metabolites in response to salt stress and recovery. (A) All metabolites identified including 212 in shoots and 179 in roots and 130 shared in both tissues. (B) Salt stress response metabolites including 59 in shoots and 60 in roots with 27 varied in both tissues. (C) Totally, 91 varied metabolites in both shoots and roots were identified including 29.7% polyols, 28.6% amino acids, 22.0% organic acids, 9.9% amides, 5.5% imides, and 4.4% other metabolites. (D) Boxplot of salt stress response metabolite variation in N4 and R3 against ST or R3 conditions in shoots and roots, respectively. The dashdot line and solid line box represents data from shoots and roots, respectively. * and □ represents the extreme and mean values in each conditions, respectively. Data was from metabolite analysis from three biological and two technical replicates.

