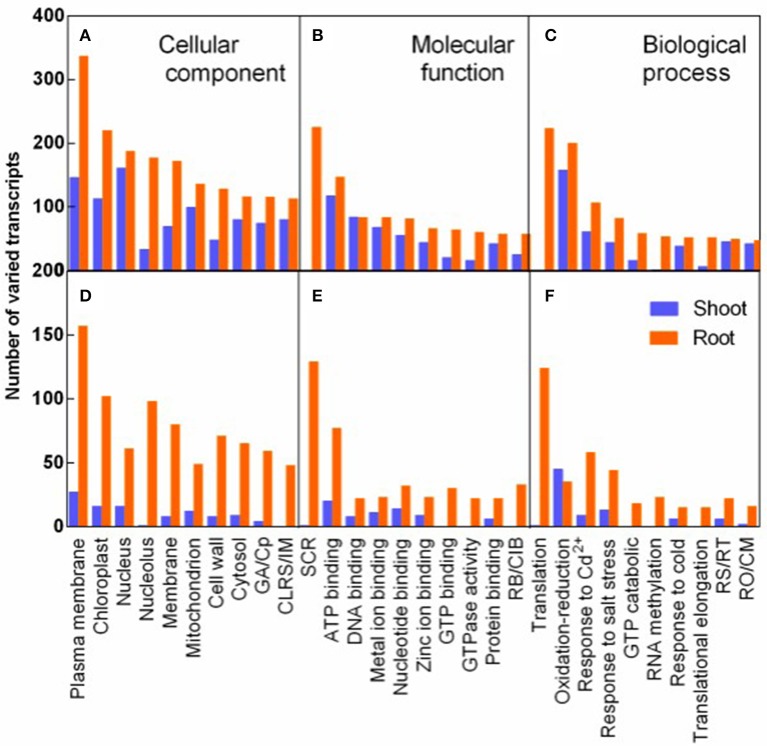
Figure 6.
GO classification analysis of DEGs in response to salt stress (A–C) and to recovery specifically (D–F). Varied transcripts were categorized into cellular component (A,D), molecular function (B,E), and biological process (C,F). ( ) and (
 ) represent varied transcripts in shoots and in roots, respectively. GA/Cp in represents Golgi apparatus term for D/Cytoplasm term for (A) in X-axis, respectively. CLRS/IM, Cytosolic large ribosomal subunit/Integral to membrane (A,D); SCR, Structural constituent of ribosome; RB/CIB, RNA binding/Copper ion binding (B,E). RS/RT, Response to stress/Regulation of translation; and RO/CM, Response to oxidative stress/Carbohydrate metabolic process (C,F).

