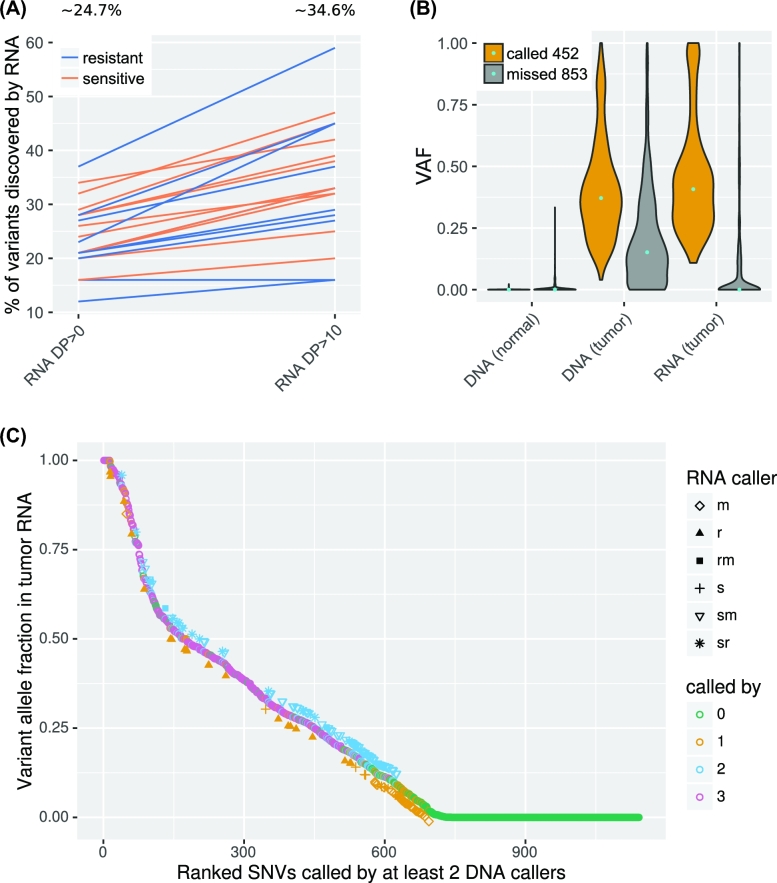
Figure 3:
Variants called in tumor DNA. (A) Percentage of concordant calls of all somatic variants from expressed genes for each sample from 2 datasets (sensitive and resistant tumor samples). A higher percentage of concordant calls was achieved in transcripts with high expression (DP>10) compared with that of all expressed transcripts (DP>0). (B) Violin plot of variant fractions for all somatic variant positions with RNA DP>10. Most of the variant positions missed by VaDiR have a low variant fraction (VAF<0.1) in RNA. (C) Ranked SNVs called by TCGA and/or different combinations of RNA-seq calling methods. Only those positions with DP>10 in tumor DNA, RNA, and normal DNA are included in the analysis. The names in the chart are the first letters of the caller SNPiR (s), RVBoost (r), and MuTect (m), or their combinations.

