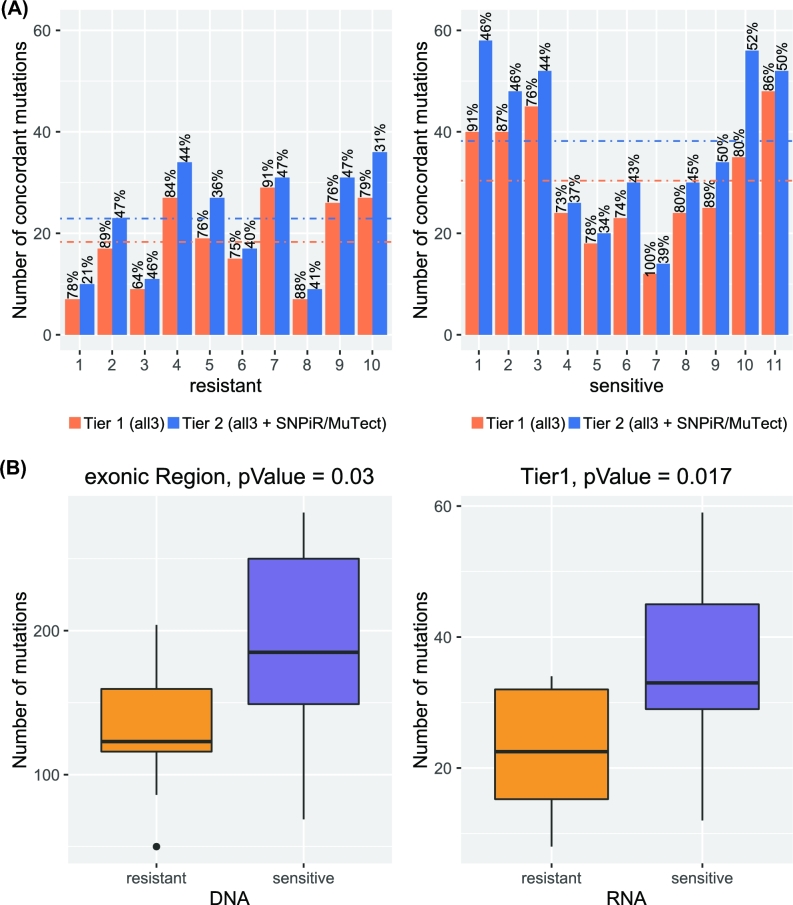
Figure 5:
Comparison of sensitive and resistant samples. (A) Numbers of concordant calls in Tier 1 and Tier 2 by VaDiR. The precision for each sample for Tier 1 and Tier 2 is shown in percentage above each bar. (B) Numbers of mutations found at the DNA and RNA levels in sensitive tumors are significantly higher than in resistant tumor samples.

