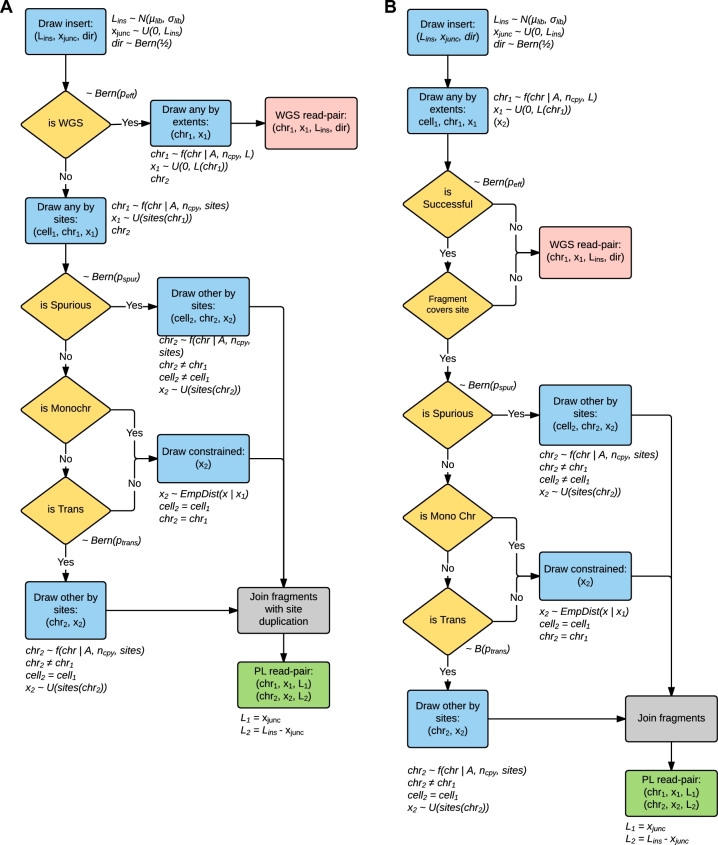
Figure 3:
Logical schema used within Sim3C. (a) Hi-C and (b) Meta3C simulation strategies. Gold diamonds represent simple Bernoulli trials. Blue boxes represent sampling distributions defined by runtime input data (community profile, genomic sequences, enzyme) and the empirically derived distribution for intra-chromosome (cis) interaction probability (equation 1). Logical end-points to a single iteration of either algorithm are represented as red (producing a WGS read-pair) and green boxes (producing a PL read-pair). Due to the elimination of the biotinylation step, Meta3C does not produce a duplication of the restriction cut-site overhang (grey boxes).

