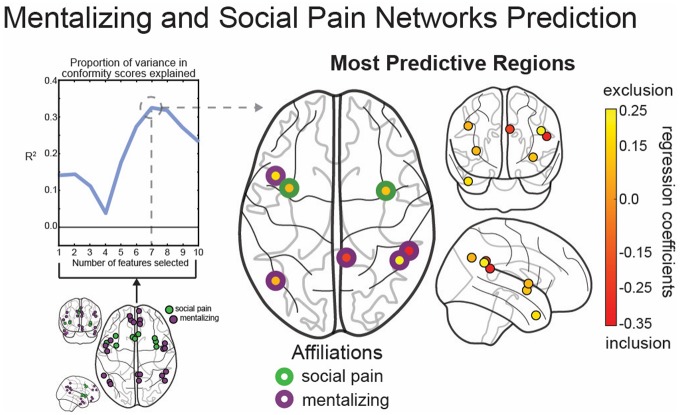
Fig. 2.
The regions in the social pain and mentalizing networks whose connectivity to the rest of the brain is most predictive of conformity; regions pictured in green and purple, respectively, in bottom left. Top left: The out-of-sample R2 values obtained when selecting between 1 and 10 regions as features in our model, with seven features being most predictive of conformity. Right: The seven regions selected by our feature-selection algorithm. The regions with a green outline are in the social pain network, while the regions with a purple outline are in the mentalizing network. The color of the center of each region indicates its regression coefficient. For yellow regions, more connectivity during social exclusion than social inclusion is predictive of conformity to the confederate’s attitude; for red regions, the opposite is true.

