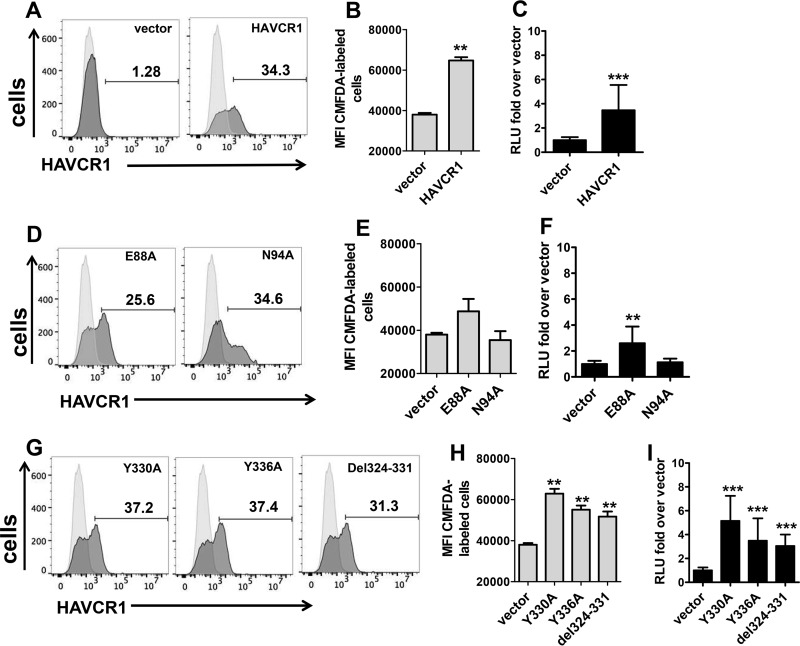
FIG 6.
Expression of HAVCR1 in KO clone 12 enhances HCV infection. HAVCR1 KO clone 12 cells were transfected with plasmids expressing HAVCR1, mutated forms of HAVCR1 (E88A, N94A, Y330A, Y336A, and del324–331 mutations), or vector. (A) Expression of HAVCR1 on the surface of clone 12 cells transfected with vector or plasmid expressing HAVCR1 48 h posttransfection was assessed using anti-HAVCR1-1 MAb. (B) Apoptotic binding activities of clone 12 cells transfected with vector or plasmid expressing HAVCR1. (C) Luciferase expression in cell lysates of clone 12 cells transfected with HAVCR1 expression plasmid and infected with JFH1-Nanoluc. Data at 24 h postinfection are shown. Four independent experiments were performed; each time point included 3 replicates. (D) Expression of E88A or N94A mutant on the surface of transfected clone 12 cells 48 h posttransfection assessed using anti-HAVCR1-1 MAb. (E) Apoptotic binding of clone 12 cells transfected with vector or plasmids expressing E88A and N94A mutant forms of HAVCR1. (F) Luciferase expression in cell lysates of clone 12 cells transfected with plasmids expressing E88A or N94A mutants and infected with JFH1-Nanoluc. Data are from 4 independent experiments, each including 3 replicates, at 24 h postinfection. (G) Expression of Y330A, Y336A, or del324–331 mutant on the surface of transfected clone 12 cells 48 h posttransfection was assessed using anti-HAVCR1-1 MAb. (H) Apoptotic binding of clone 12 cells transfected with vector or plasmids expressing Y330A, Y336A, and del324–331 mutant forms of HAVCR1. (I) Luciferase expression in cell lysates of clone 12 cells transfected with Y330A, Y336A, or del324–331 mutant plasmids and infected with JFH1-Nanoluc. Data are from 4 independent experiments, each including 3 replicates, at 24 h postinfection. Horizontal bars represent the mean values. Asterisks represent significance values obtained using the Mann-Whitney test to compare the mean values for vector-transfected cells with the mean values for each of the other transfectants. NS, not significant; **, P < 0.001; ***, P < 0.0001. For FACS histograms, HAVCR1 expression on transfected cells is shown as filled dark-gray areas, and data for untransfected cells stained with anti-HAVCR1-1 MAb are shown as filled light-gray areas. RLU, relative light units; MFI, mean fluorescence intensity.

