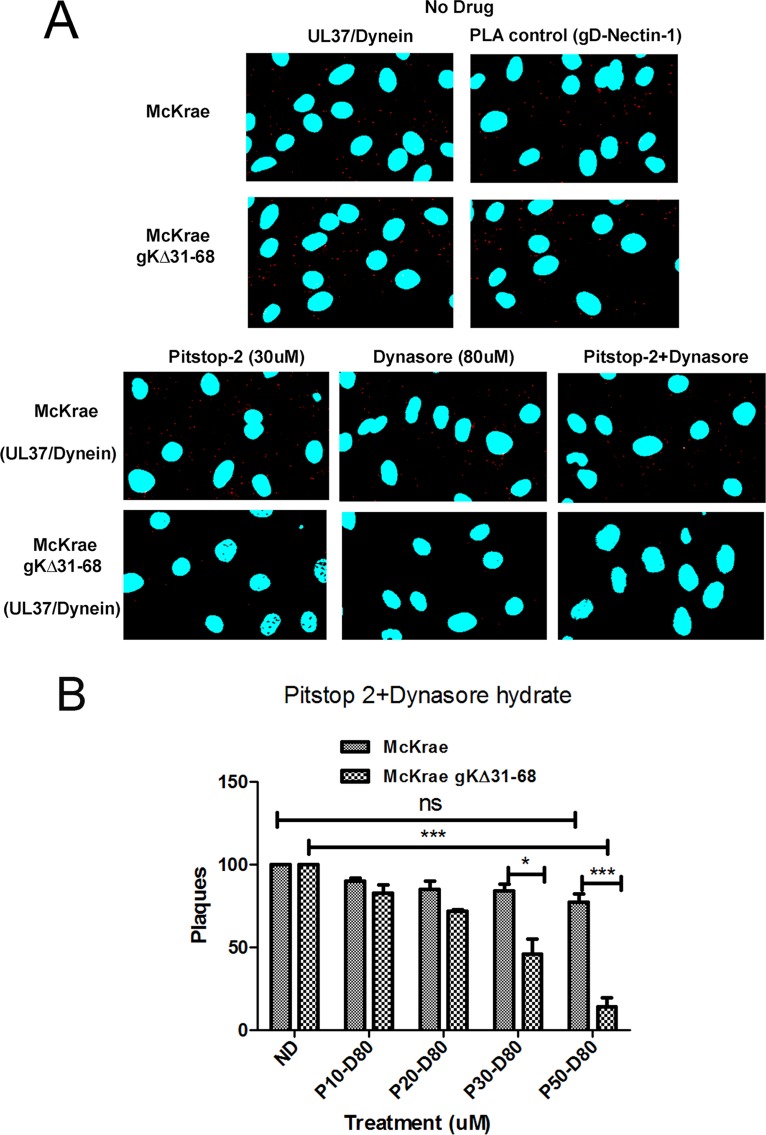
FIG 6.
Endocytosis assay. (A) SK-N-SH cells were treated with no drug, 30 μM pitstop-2, or 80 μM dynasore hydrate or with 30 μM pitstop-2 plus 80 μM dynasore hydrate in combination for 30 min at 37°C. Cells were infected with either McKrae or McKrae gKΔ31-68 for 1 h at an MOI of 10 at 37°C and then prepared for PLA. The UL37-dynein interaction was used as a measure of entry of the viral capsid into the cell, and the gD–nectin-1 interaction was used as a PLA control. Confocal microscopy was used to detect the bright red spots that suggest the interaction between two proteins. DAPI was used to stain the nuclei of the cells. Magnifications 63× with oil immersion. (B) Vero cells were treated with combined doses of pitstop-2 at 10, 20, 30, or 50 μM (P10, P20, P30 and P50, respectively) and dynasore hydrate at 80 μM (D80) for 30 min at 37°C and then infected with 100 PFU the McKrae or McKrae gKΔ31-68 virus for 1 h at 37°C (without washing the drug off). After infection, the wells were washed with PBS and methylcellulose was added. The plaques (the numbers of PFU) were counted using crystal violet staining after 48 h. *, P < 0.05 versus the no-drug-treated control (ND); ***, P < 0.001 versus the no-drug-treated control. Statistical comparison was conducted by GraphPad Prism software using ANOVA with a post hoc t test with the Bonferroni adjustment. Bars represent the 95% confidence intervals about the means.

