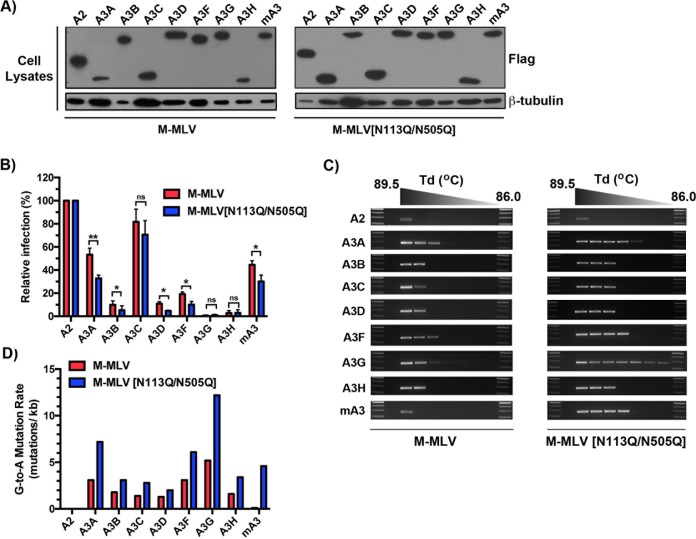
FIG 7.
Impacts of glycosylation site mutations on deamination and restriction by all 7 members of the human A3 family. (A) FLAG-tagged APOBEC expression plasmids were cotransfected with M-MLV or M-MLV[N113Q/N505Q] into 293T cells. Two days following transfection, cells were harvested and assessed for FLAG expression by Western blot analysis. The expression of β-tubulin was used as a loading control, and viral capsid protein expression was assessed using a monoclonal anti-p30 antibody. (B) NIH 3T3 cells were infected with p30-normalized amounts of the viruses produced for panel A. Infection was monitored as a function of EGFP reporter protein expression 48 h later by flow cytometry. Infection assays were performed for two independent transfections, with triplicate infection values for each. Results are presented as normalized mean infection values ± standard deviations (SD) relative to that for the A2 control. (C) Deamination intensity analysis by 3D-PCR. The analysis was performed on genomic DNAs extracted from infected NIH 3T3 cells at 48 h postinfection as described in the legend to Fig. 4D. (D) Genomic DNAs from infected target cells were amplified by PCR and cloned, and the EGFP gene was sequenced. Mutation rates reflect the averages for 8 independently mutated clones. P values were calculated by Student's t test. *, P ≤ 0.05; **, P ≤ 0.01; ns, P > 0.05.

