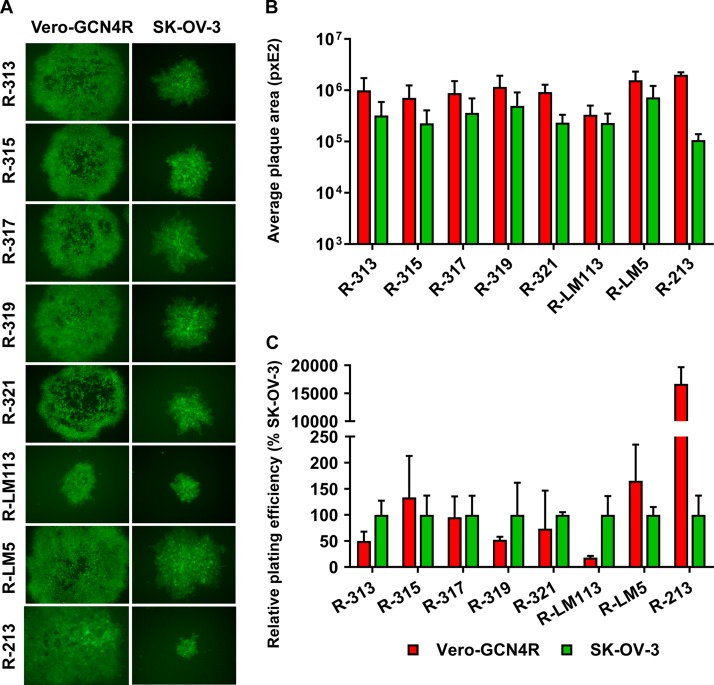
FIG 4.
Plating efficiency and relative plaque sizes of the indicated recombinants in Vero-GCN4R and SK-OV-3. (A) A typical plaque is shown for each recombinant in the indicated cells. (B) Average plaque size of the indicated recombinants in Vero-GCN4R and SK-OV-3. Six pictures were taken for each recombinant. Plaque areas were measured by means of Nis Elements-Imaging software (Nikon). (C) Replicate aliquots of recombinants were plated in SK-OV-3 and Vero-GCN4R cells. Plaques were scored 3 days later. The relative number of plaques formed by each virus in the indicated cell line is reported as percentage of the number of plaques formed in SK-OV-3 cells. Results represent the averages ± SD from triplicates. The level, brightness, and contrast of the panel were adjusted as follows: +30 +80 +30. The level, brightness, and contrast of R-213 pictures were adjusted as follows: 0 +100 +30.

