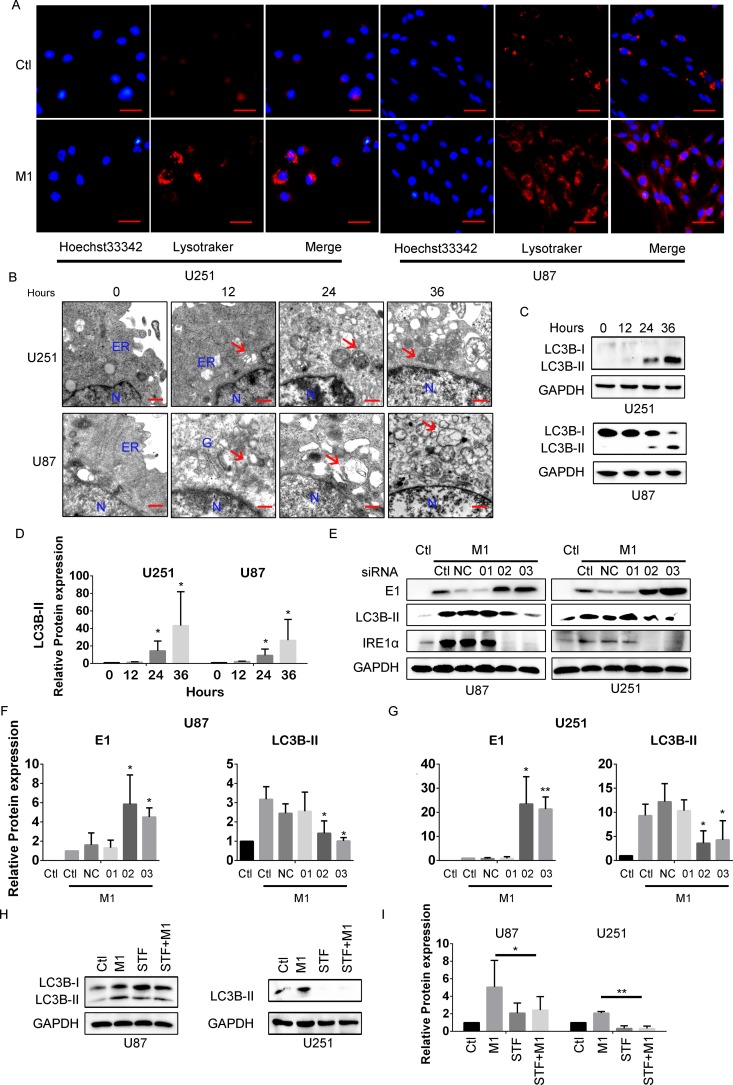
FIG 4.
M1 virus infection induces autophagy through IRE1α. (A) LysoTracker staining was used to visualize intracellular later-phase autophagosomes. Cells were infected with the M1 virus (1 PFU/cell) for 24 h, and LysoTracker staining was performed according to the manufacturer's procedure. Hoechst 33342 staining was performed 10 min before capture of photographs. Scale bars, 0.25 μm. (B) Ultrastructural observation of cancer cells after infection with the M1 virus. U87 and U251 malignant glioma cells were infected with the M1 virus (1 PFU/cell) and observed with a transmission electron microscope. ER, endoplasmic reticulum. N, Nucleus. The red arrows indicate autophagosomes. Scale bars, 500 nm. (C) Expression of the autophagy marker LC3B using Western blotting. (D) Quantification of the data from panel C. (E) LC3B detection after knockdown of IRE1α. U87 and U251 malignant glioma cells were transfected with scramble RNA or IRE1α siRNAs (50 nM) for 48 h. The indicated protein expression levels were determined 8 h after viral infection. (F and G) Quantification of the data from panel E. (H and I) LC3B expression after STF083010 treatment for 24 h. Whole-cell lysates were collected, and Western blotting was performed. *, P < 0.05; **, P < 0.01.

