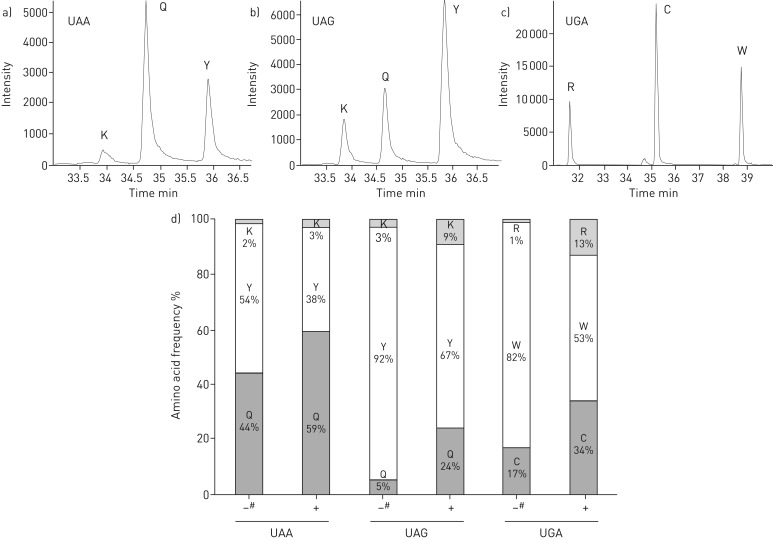
FIGURE 3.
Quantification of readthrough peptides in the presence of paromomycin. a–c) Mass spectrometry extracted-ion chromatograms of readthrough peptides for UAA, UAG and UGA stop codons. d) Relative frequencies of the readthrough amino acids incorporated at UAA, UAG and UGA in the presence (+) and absence (−) of paromomycin. Quantifications were performed as described in the Materials and methods section. #: data previously obtained by Blanchet et al. [16] in the same conditions.

