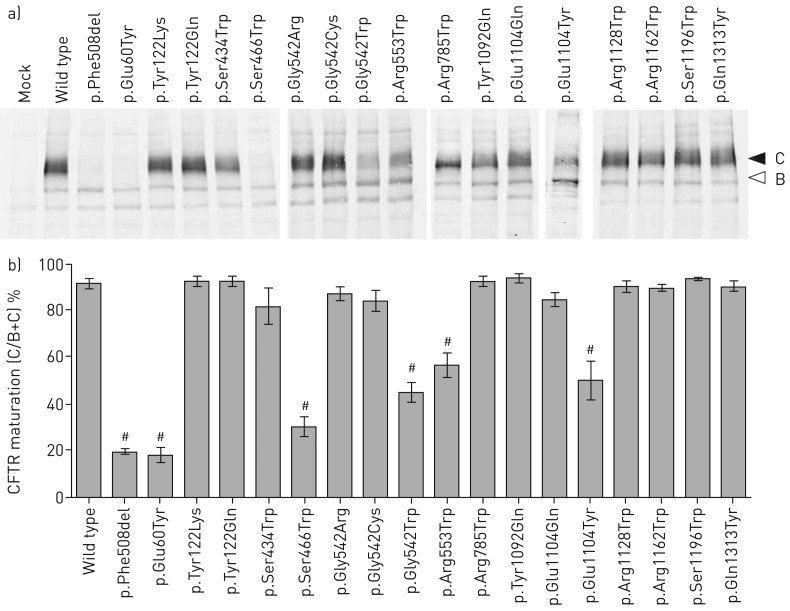
FIGURE 5.
Maturation of recoded cystic fibrosis transmembrane conductance regulator (CFTR) channels. a) Representative Western blot obtained from HEK293 cells expressing the indicated construct. CFTR bands C and B are indicated. b) CFTR maturation as measured using the C/(B+C) ratio under control conditions. #: significant difference compared with wild-type control conditions (p<0.01, ANOVA followed by a Fisher test).

