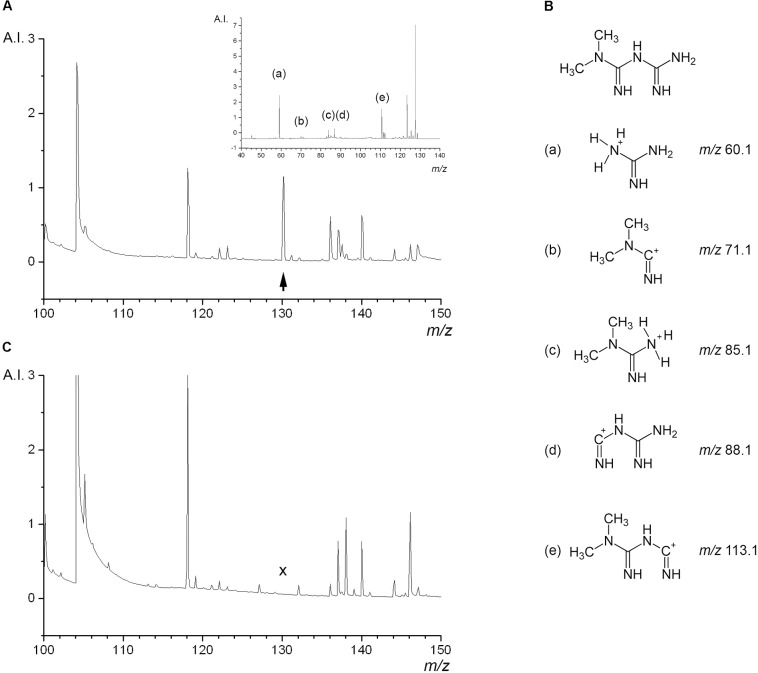
FIGURE 3.
Mass spectrometric properties of metformin in liver tissue background. Thin-sections of freeze-clamped rat livers perfused with or without metformin were analyzed by MALDI TOF mass spectrometry. (A, main image) Shows the mass spectrum of liver tissue containing metformin, the peak at 130.16 m/z corresponding to the parent molecular mass of metformin is indicated with an arrowhead. (A, inset) Shows the LIFT MS/MS spectrum of the 130.16 m/z parent ion with the peaks of fragment ions of metformin. (B) Structure of metformin and detected fragment ions indicated with letters. (C) Shows the mass spectrum of liver tissue perfused without metformin, lacking the peak at 130.16 m/z (cross). Arbitrary intensity (A.I.) represents the unit reported by the FlexImagingTM software package.

