FIGURE 4.
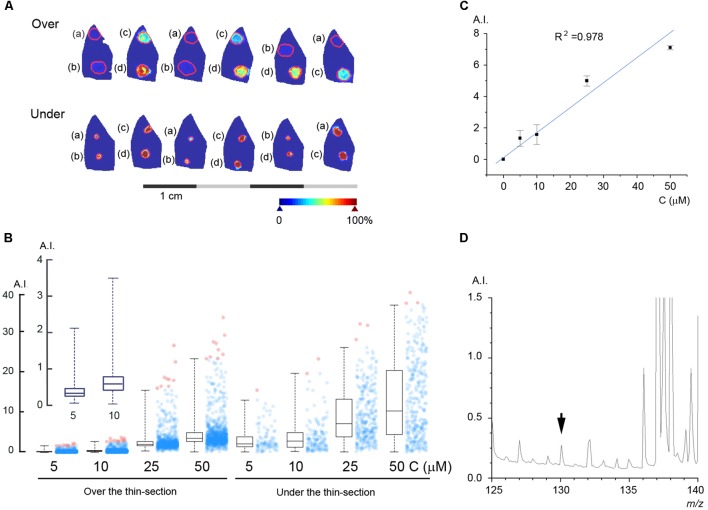
Estimation of the metformin concentration in the liver parenchyma. (A) Known quantities of metformin were spotted either on top of (Over) or under (Under) thin-sections of rat livers perfused without metformin: (a) 5 μM, (b) 10 μM, (c) 25 μM, and (d) 50 μM. (B) Box plot of the pixel values obtained for each spot of metformin. Box lines are median, first and third quartiles, and whiskers show the 2nd and 98th percentiles. The average number of pixels for each ROI was 896. (B, inset) Shows the peak intensity for 5 and 10 μM metformin. (C) Standard curve with linear regression calculated from the average of the values obtained by applying standard on top of and under the thin-section, respectively. (D) The mass spectrum of a liver thin-section with 250 nM metformin, as indicated (arrowhead). Arbitrary intensity (A.I.) is reported as in Figure 3.

