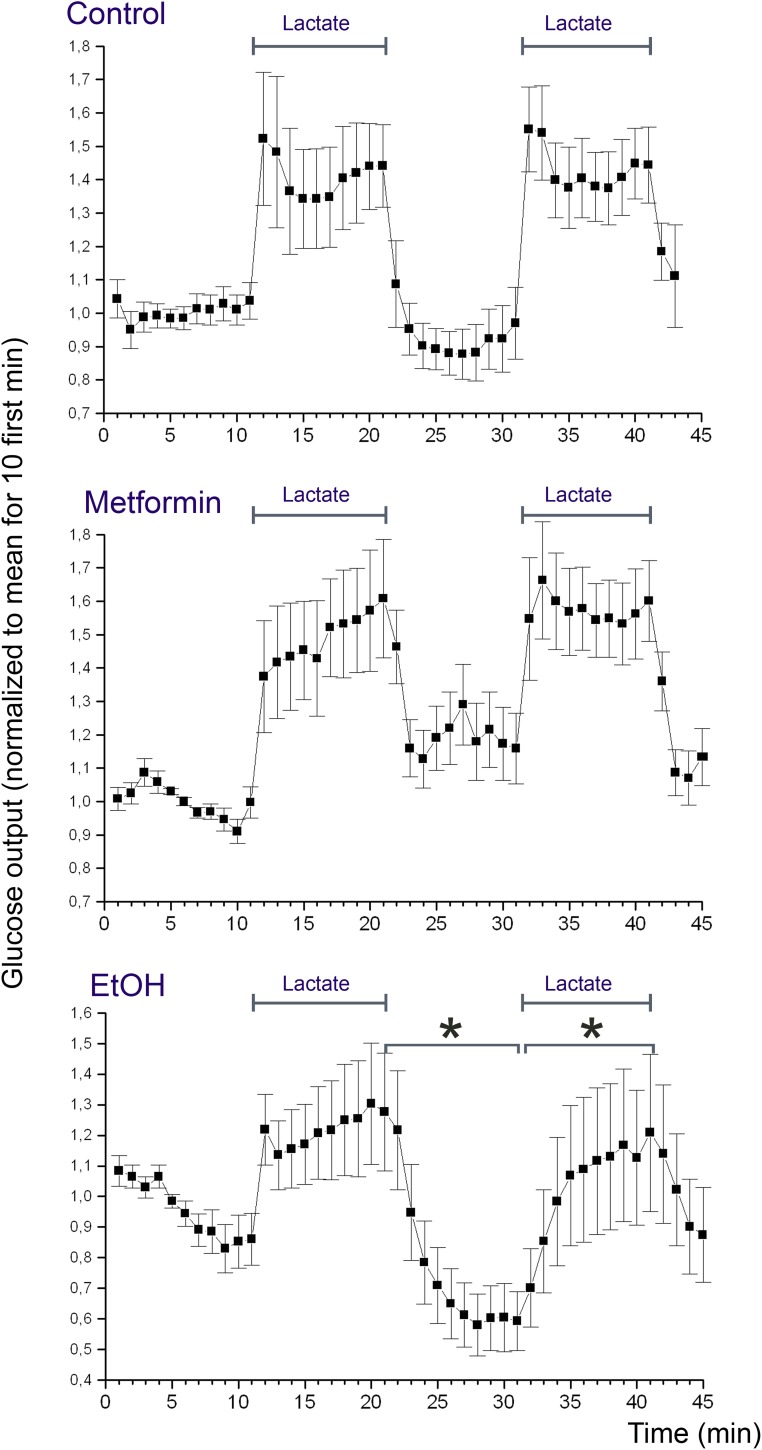
FIGURE 6.
Glucose release from the perfused liver. Rat livers were perfused according to protocol B (Control), C (Metformin), or D (EtOH). The presence of lactate in the medium is indicated with bars (Lactate). The effluent medium was collected in 1 min fractions following passage through the liver. The glucose concentration of the effluent medium was determined using a coupled enzyme assay (mean values ± SD, n = 10 for each experimental group). Concentrations were normalized by setting the average of the 10 first measurement points to one. For each rat, the glucose concentration of the effluent medium after addition of metformin or ethanol was compared to that before addition. Statistical significance (p < 0.01) was assessed as described in Section “Statistical Analysis.”

