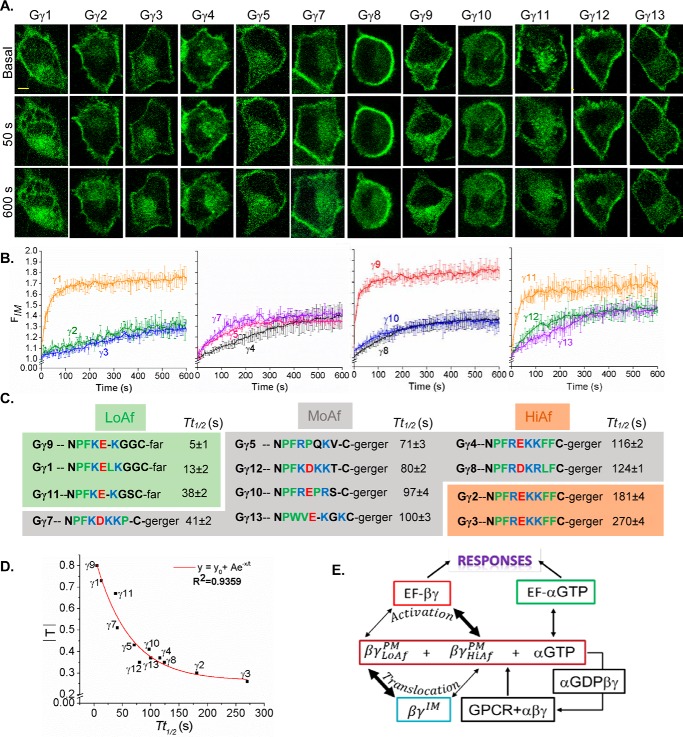
Figure 2.
Gγ-identity driven differential translocation of Gβγ. A, HeLa cells expressing blue opsin–mTurquoise and each of the 12 Gγ subunits with a YFP fluorescent tag. Cells were supplemented with 50 μm retinal and were imaged for YFP (515 nm) and activated with 445 nm light at 2-s intervals in a time-lapse series. This process was continued for 10 min where the YFP fluorescence changes reached the equilibrium. B, plots show baseline normalized YFP fluorescence increase in IMs over time (error bars, S.E.; n = 10; scale bar, 5 μm). C, alignment of carboxyl termini (CT) sequences of 12 Gγ, indicating the properties of amino acids (red, acidic; blue, basic; green, hydrophobic uncharged; black, other residues) and their translocation half-time values (Tt½). Here, Gγ types are grouped, based on their PM affinities. D, plot of Tt½ versus |T| shows an exponential decay relationship. E, schematics of GPCR activation–induced G protein heterotrimer activation and dissociation. LoAf-Gβγ translocates from the PM to IMs faster compared with HiAf-Gβγ, whereas HiAf-Gβγ interacts with effectors to initiate signaling pathways leading to cellular responses efficiently compared with LoAf-Gβγ.

