Figure 3.
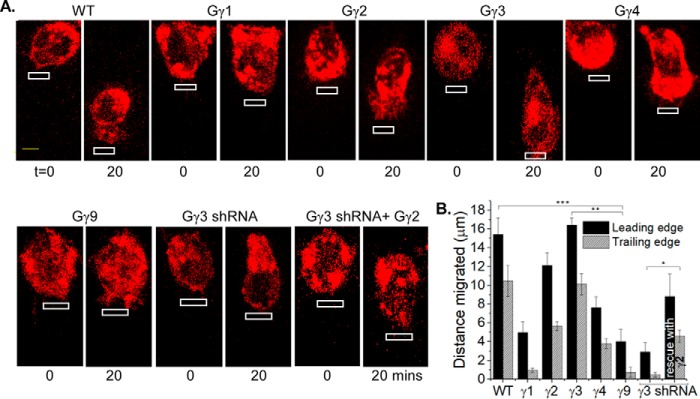
Subtype-specific control of macrophage migration by Gγ. A, RAW 264.7 cells expressing blue opsin–mCherry and a selected Gγ subunit, supplemented with 50 μm 11-cis-retinal. Blue opsin was activated in confined regions of cells using a 445 nm laser with 0.22 microwatts/μm2 power in every 2-s interval (white boxes). The images show cells before and after 20 mins of blue opsin activation. Note the difference in cell movement toward the optical input with respect to the Gγ type the cell possesses. Gγ3 expressing cell shows an almost identical cell migration as the WT, and Gγ2 also supports migration. Note the inhibition of cell migration in Gγ3 knockdown cells. This migration loss was rescued by expressing HiAf-Gγ2, but none other. B, bar graph shows the relative displacement of cells' leading and trailing edges, with blue opsin activation (error bars, S.E.; n = 12; *, p = 0.021; **, p < 0.0001; ***, p < 0.0001; scale bar, 5 μm).

