Figure 4.
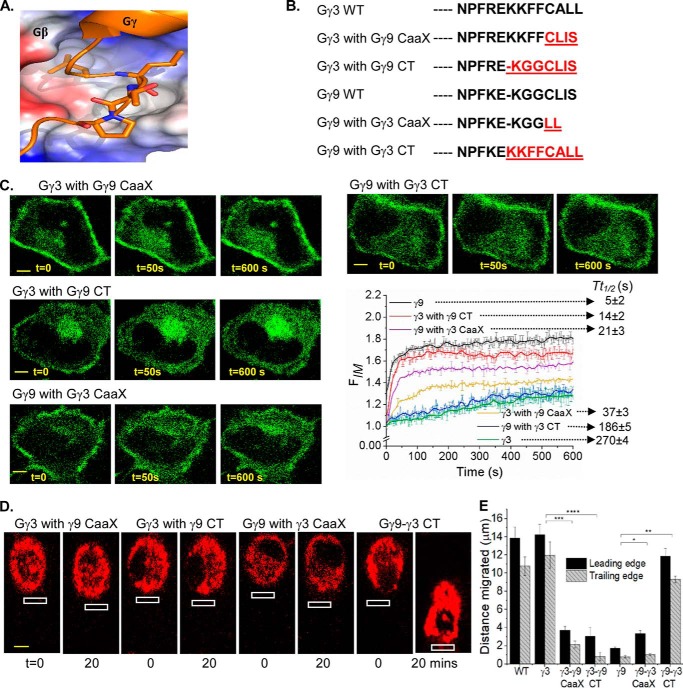
Carboxyl terminus of Gγ governs rates of Gβγ translocation and the extent of cell migration. A, crystal structure of the CT region of Gγ in complex with Gβ (∼Phe-59 of Gγ, the last Gβ contact point) exposing the hydrophobic binding pocket in Gβ. B, sequence alignment of CT mutants of Gγ3 and Gγ9. C, HeLa cells expressing GFP-Gγ mutants and blue opsin–mCherry, supplemented with 11-cis retinal. The cells were imaged for GFP (488 nm) to capture blue opsin activation–induced translocation. Note the significant difference in mutant translocation compared with WT counterparts (error bars, S.E.; n = 10; scale bar, 5 μm). D, RAW 264.7 cells expressing each of the mutant Gγ and blue opsin–mCherry, supplemented 11-cis-retinal. Blue opsin in cells were activated locally (white box) in 2-s intervals for 20 min to induce migration. E, the histogram shows the movement of leading and trailing edges. Permutations to the CT sequences clearly altered the cell migration ability (error bars, S.E.; n = 12; *, p = 0.0009 for the leading edge and 0.5714 for the trailing edge; **, p < 0.0001; ***, p < 0.0001; ****, p < 0.0001; scale bar, 5 μm).

