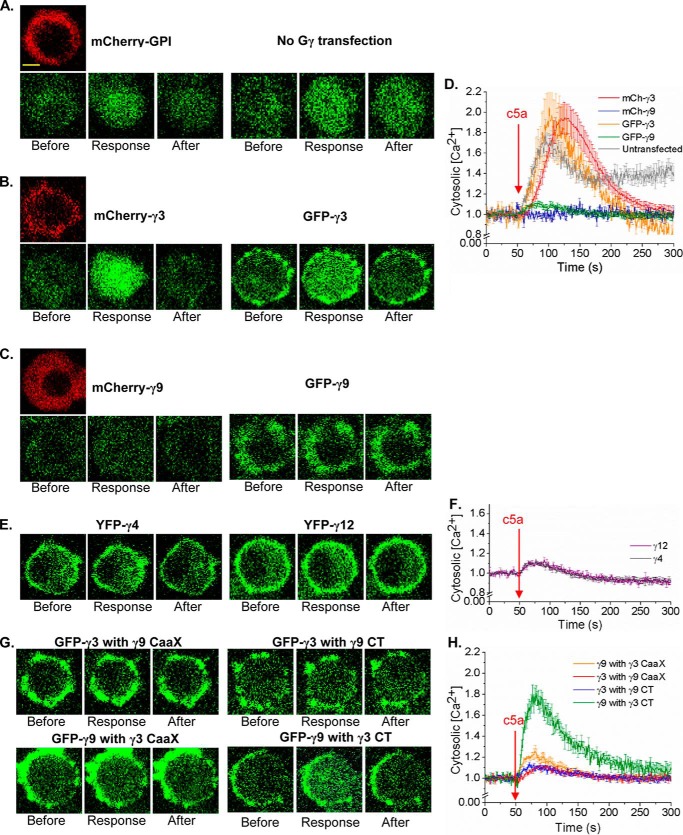
Figure 6.
PLCβ activation induced differential Ca2+ response with different Gγs. RAW 264.7 cells expressing different WT Gγs and Gγ mutants were stimulated with 10 μm c5a addition to activate endogenous c5a receptors (c5aRs) after 30-min Fluo-4 incubation. Cells were imaged at 40× magnification to capture the Ca2+ response. A–C, control (A) (mCherry-GPI and untransfected), (B) Gγ3 expressing cells showed greater Ca2+ response compared with (C) Gγ9 expressing cells, which showed almost no Ca2+. Scale bar, 10 μm. D, plot shows the difference in Fluo-4 signal (GFP fluorescence) increase in cells, indicating differential Ca2+ release to the cytoplasm depending on the Gγ subtype they overexpress. Also, it shows that the fluorescent tag of the Gγ subtype is not affecting the Ca2+ response (n = 8). E and F, MoAf-Gγ4 and Gγ12 expressing cells showed minor Ca2+ response with c5AR activation (n = 8). G and H, Gγ9 mutants with Gγ3 CaaX and Gγ3 CT showed an increased Ca2+ response compared with WT Gγ9, whereas Gγ3 with Gγ9 CaaX and Gγ9 CT showed a reduced Ca2+ response compared with WT Gγ3, confirming differential Gβγ-effector interactions with respect to the difference in the PM affinity thus different PM residence times of Gβγ (error bars, S.E.; scale bar, 10 μm).

