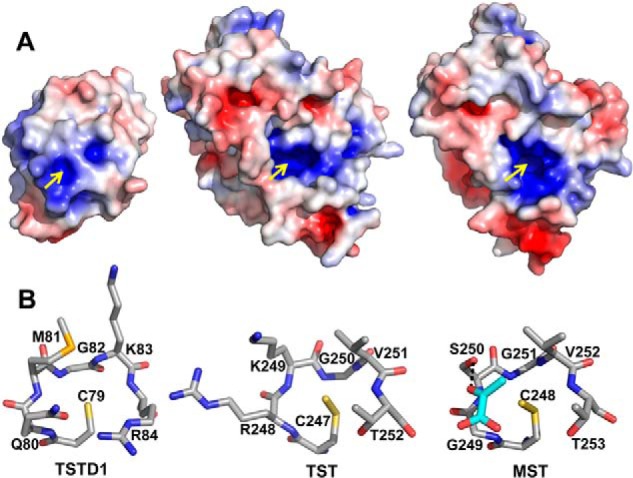
Figure 3.

Comparison of TSTD1 with rhodanese. A, surface electrostatic potential representation of TSTD1 highlighting its exposed active-site pocket, bovine rhodanese (PDB code 1RHD), and MST (PDB code 4JGT). Positive and negative electrostatic potentials are shown in blue and red, respectively, in the range of ±5 kT/e. The yellow arrows point to the active-site cysteines. B, structural comparison of the rhodanese active-site loops of TSTD1, bovine rhodanese, and MST. Pyruvate bound in the active site of MST is shown in cyan.
