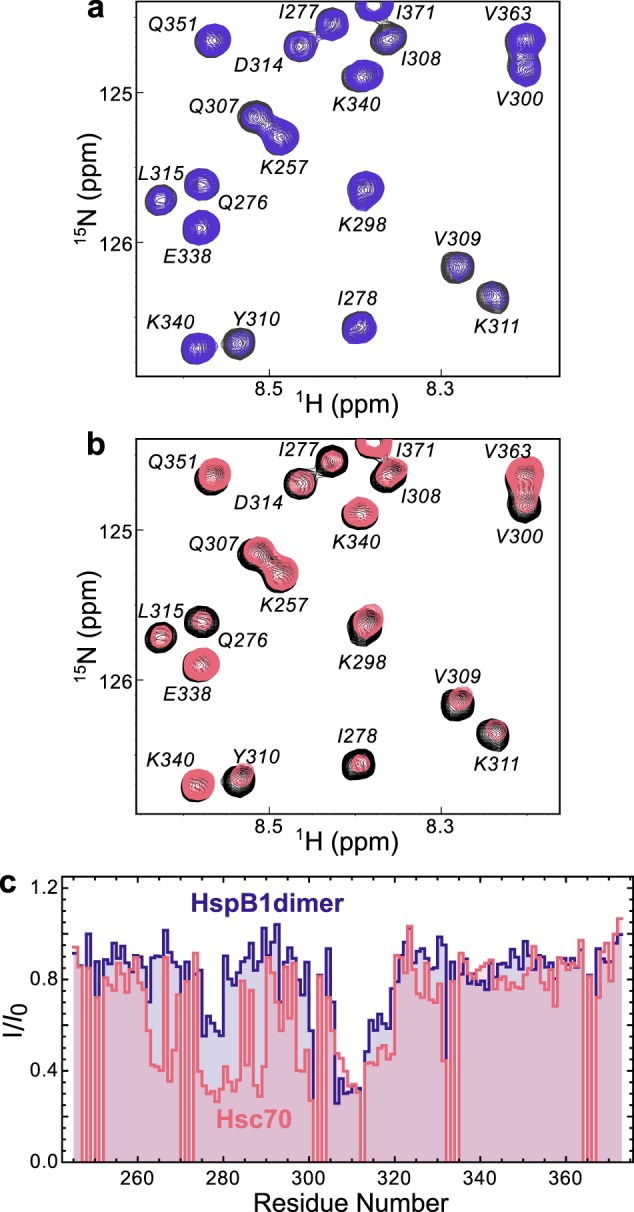
Figure 4.

Chaperone binding sites. a, 15N HSQC TROSY of 15N-labeled tau4RD alone (black) and in the presence of 2 molar eq of HspB1dimer (blue). b, 15N HSQC TROSY of 15N-labeled tau4RD alone (black) and in the presence of 2 molar eq of Hsc70 (red). c, peak broadening from a and b, quantified by dividing the intensity of a peak in the bound spectrum (I) by the intensity of the same peak in the unbound spectrum (I0). Broadening due to HspB1dimer maps primarily to the aggregation-prone motif in the third repeat of tau4RD (306VQIVYK311), whereas broadening due to Hsc70 maps to the aggregation-prone motifs at the start of both the second and third repeats of tau4RD (275VQIINK280 and 306VQIVYK311).
