Figure 7.
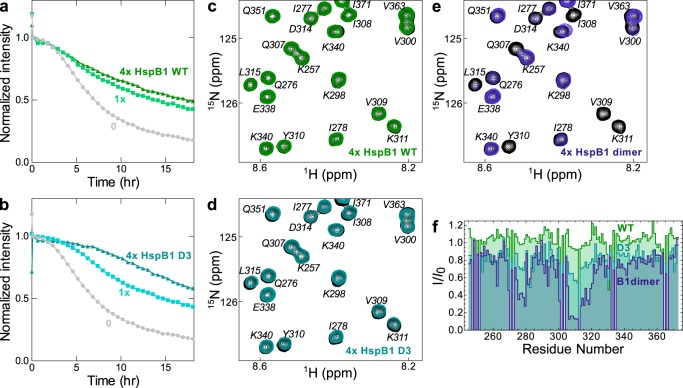
Effects of HspB1WT and HspB1D3 on tau4RD. a, intensity from 1D NMR spectra monitoring the disappearance of small, soluble tau4RD species during aggregation in the presence of HspB1WT. HspB1WT (green squares and triangles) slows this intensity loss in a manner similar to HspB1dimer (Fig. 3a). b, intensity from 1D NMR spectra monitoring tau4RD aggregation in the presence of HspB1D3 (teal squares and triangles). HspB1D3 slows intensity loss in a manner similar to HspB1dimer and WT. c, 15N HSQC TROSY of 15N-labeled tau4RD alone (black) and in the presence of 4 molar eq of HspB1WT (green). There is very little significant broadening in the spectrum with HspB1WT, suggesting that binding is very weak. d, 15N HSQC TROSY of 15N-labeled tau4RD alone (black) and in the presence of 4 molar eq of HspB1D3 (teal). There is slight broadening in peaks corresponding to 306VQIVYK311, indicating some binding. e, 15N HSQC TROSY of 15N-labeled tau4RD alone (black) and in the presence of 4 molar eq of HspB1dimer (blue). Peak broadening is much more substantial, indicating that HspB1WT and D3 both bind more weakly than HspB1dimer. f, quantification of tau 4RD peak intensity loss due to HspB1WT, HspB1D3, and HspB1dimer binding.

