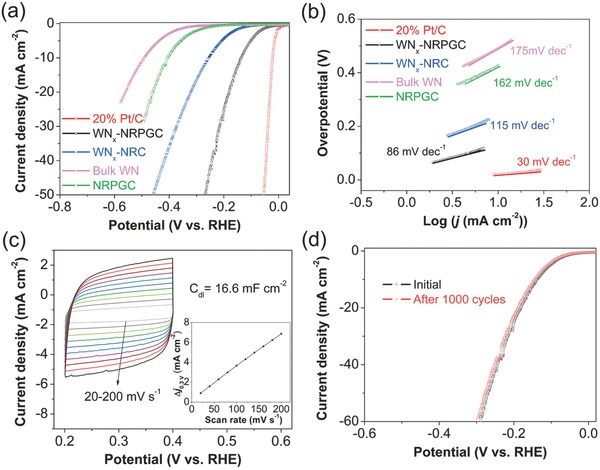
Figure 3.

a) Polarization curves after iR compensation in 0.5 m H2SO4 at a scan rate of 5 mV s−1 and b) corresponding Tafel plots of WNx‐NRPGC, WNx‐NRC, NRPGC, Bulk WN, and 20% Pt/C catalysts. c) Electrochemical CV scans recorded for WNx‐NRPGC at different rates from 20 to 200 mV s−1 in the potential range of 0.2–0.4 V. Inset: Linear fitting of the capacitive currents versus CV scan rates for WNx‐NRPGC. d) Polarization curves of WNx‐NRPGC initially and after 1000 CV cycles.
