Figure 4.

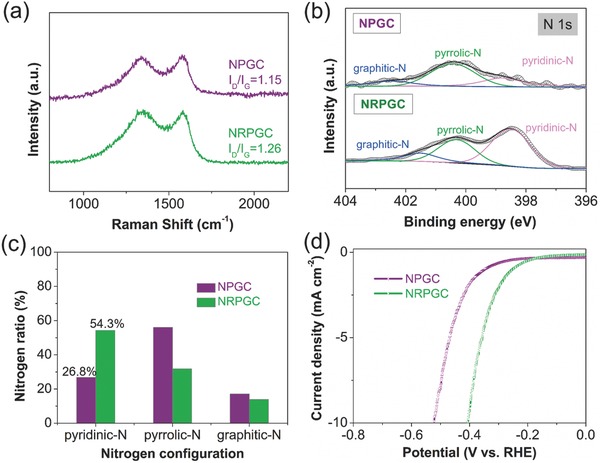
a) Raman spectra, b) high‐resolution N 1s spectra, c) comparison of the ratios of three doped N configurations and d) polarization curves of NRPGC and NPGC.

a) Raman spectra, b) high‐resolution N 1s spectra, c) comparison of the ratios of three doped N configurations and d) polarization curves of NRPGC and NPGC.