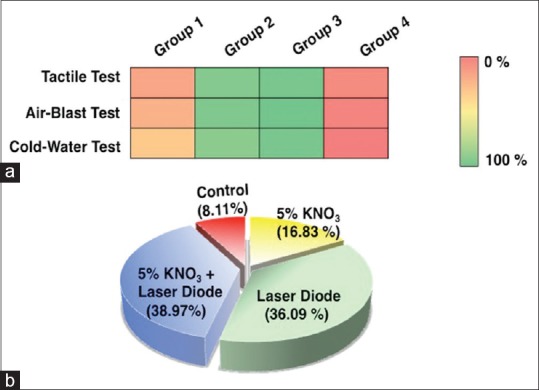
Figure 3.

Statistical analysis indicating the variation in the results (a) heat plot showing variation in four different groups with three diagnostic tests, and (b) pie chart presenting the effectiveness of applications on treating dentinal hypersensitivity
