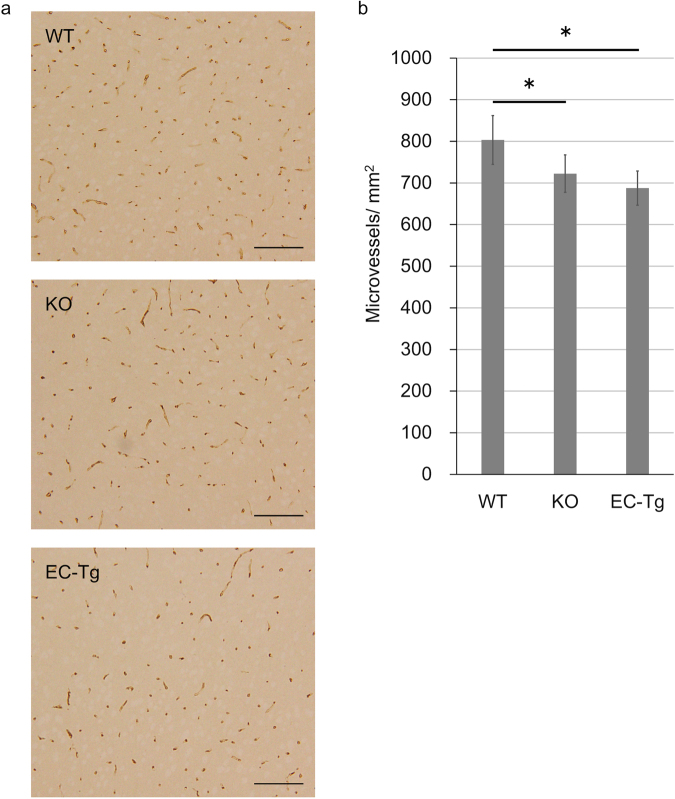
Figure 4.
Cerebral cortex stained for glucose transporter 1 (Glut1) of surviving mice. (a) Representative images of Glut1-immunostained sections of cerebral cortex of WT, KO and EC-Tg mice at 28 days after BCAS. Scale bar represents 100 μm. (b) Quantified results of cerebral microvessels. A column with a bar represents mean ± SD of the number of cerebral microvessels/mm2. There was a significant difference in the number of cerebral microvessels between the three genotypes using one-way ANOVA (WT, n = 6; KO, n = 5; EC-Tg, n = 8; p = 0.002). There were significant differences between KO and WT (p = 0.034) and between EC-Tg and WT (p = 0.001) using Tukey’s test; *p < 0.05 vs WT.

