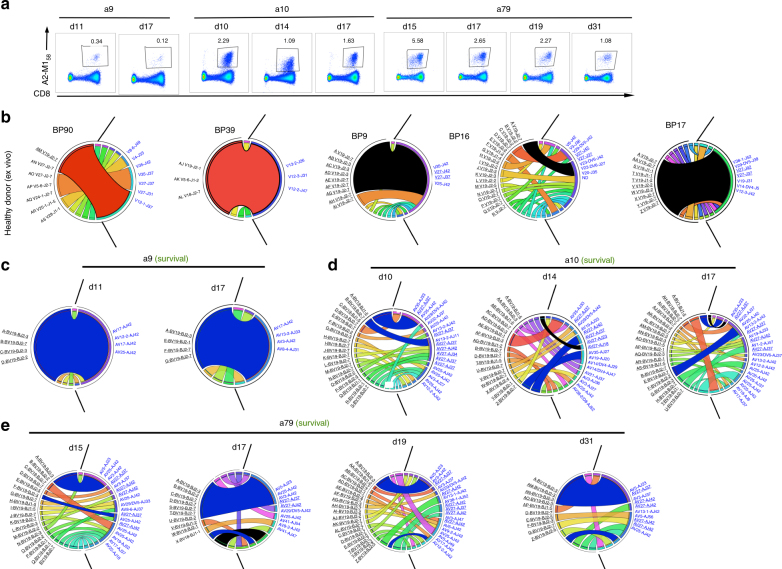
Fig. 3.
TCRαβ repertoire diversity and stability within A2-M158+CD8+ T cells in H7N9. a FACS profiles are shown for A2-M158+CD8+ T cells after tetramer staining directly ex vivo for a9, a10, and a79 patients. A2-M158+CD8+ T cells were single cell-sorted for TCRαβ repertoire analysis using a multiplex RT-PCR and sequencing. Populations were gated on viable Dump−tetramer+CD3+CD8+ events. Circos plots of frequencies of Vβ-Jβ (in black) and Vα-Jα (in blue) usage in paired TCRαβ sequences are shown for b memory A2-M158+CD8+ T cells in five healthy donors at one time-point or c–e activated A2-M158+CD8+ T cells in hospitalized patients (a9, a10, and a79) at different time-points after influenza infection. The width of the band is proportional to the frequency and each band represents a unique clone. Red segments represent private dominant A2-M158-specific TCR clones, black segments represent public A2-M158-specific TCR clones. Blue segments represent private dominant A2-M158-specific TCR clones present across different time-points in the H7N9 patients. Prominent TRBV19 and TRAV27 segments are underlined. Circos plots were generated with the Circos software package40

