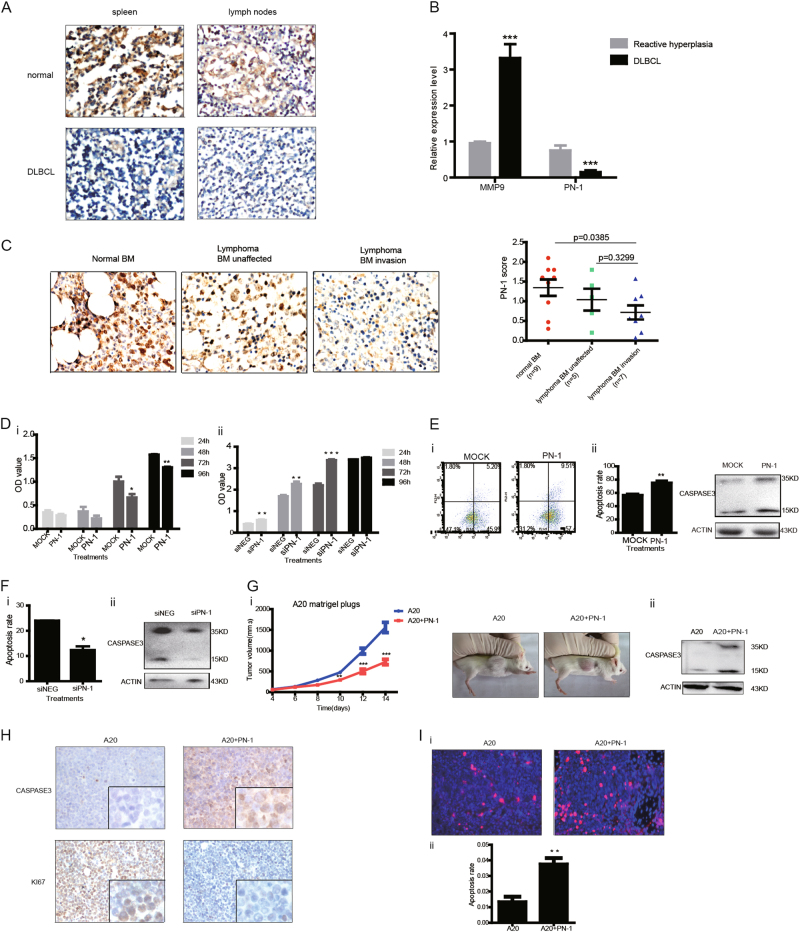
Fig. 1. The expression pattern of PN-1 in DLBCL and its functional impact on lymphoma cell proliferation and apoptosis.
a Immune histo-chemical staining (brown) of PN-1 in spleen and lymph nodes from normals or infiltrated with DLBCL cells. Blue stain represents haemotoxylin nuclear staining. b Quantitative real-time PCR for the expression of MMP9 and PN1 in lymph nodes hyperplasia (LN) and DLBCL. N = 6, ***P < 0.001. Student's t test was performed for statistical significance. c DAB staining of PN-1 (brown, panel i) and relative expression score (ii) in controls with a normal bone marrow (N = 9), persons with lymphoma with an involved (N = 7) or uninvolved bone marrow (N = 6). One-way ANOVA performed for statistical significance. d Proliferation of Raji cells (2 × 10⁶) was analyzed by using CCK-8 assays at 24, 48, 72, and 96 h after transfection with 2 μg of pcDNA3-PN1 or control plasmid (i) or followed by treatment of 40 pmol siRNA PN1 (siPN1) or control scrambled siRNA (siNEG) (N = 3; t test *P < 0.05; **P < 0.01; ***P < 0.001); e Apoptosis analysis was determined by Annexin-PI assay (i) and immune-blotting of cleavage of caspase-3 (15-kDa active band) (ii) in Raji cells transfected with 2 μg of pcDNA3-PN1 or control plasmid (N = 4; t test **P < 0.01); f Raji cells transfected with siRNA PN1 (siPN1) or control siRNA (siNEG) were assayed for apoptosis (N = 3; t test *P < 0.05); g Subcutaneous tumor volumes from Balb/c mice implanted with A20 cells (1 × 10⁶) mixed with Matrigel with or without PN-1 recombinant protein (10 μM). Subcutaneous tumor growth curve (i) (N = 5; t test, **P < 0.01; ***P < 0.001) and tumor volumes (ii); immune-blotting detecting caspase-3 cleavage (iii); h A20 xenografts with or without pre-treatment with PN-1 (10 μM) recombinant protein, DAB-stained (brown) for caspase-3 and Ki67. Blue stain represents hematoxylin nuclear staining. (i) in situ apoptotic assay using TUNEL. Positive cells (red stain) were counted from three microscopic fields and plotted (N = 4, t test, **P < 0.01). Nuclei are blue stained

