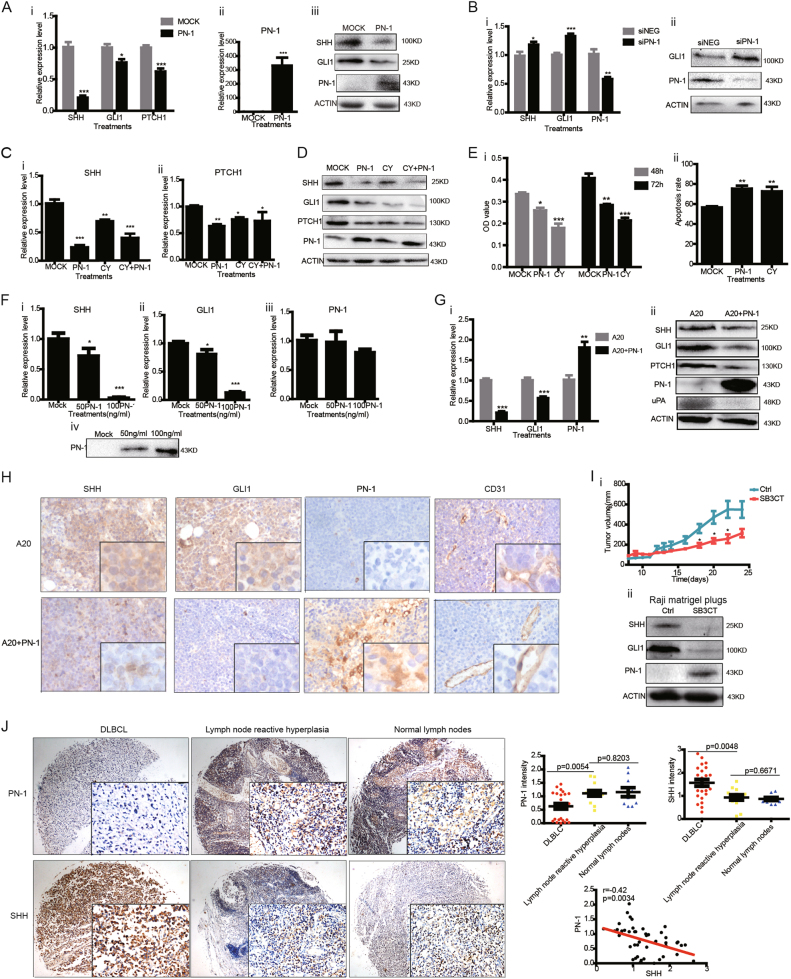
Fig. 2. PN-1 inhibits SHH signaling and angiogenesis of B cell lymphoma.
a Real-time PCR (i–ii) and immunoblotting (iii) were applied to determine the expression of PN1, GLI1, PTCH1, and SMO in Raji cells transfected with a PN1 expression plasmid or empty vector (2 μg) for 24 h (N = 5, t test, *P < 0.05; ***P < 0.001). b Raji cells transfected with 40 pmol siRNA PN1 (siPN1) or control siRNA (siNEG) were measured for PN1, SHH, or GLI1 transcript levels using qRT-PCR (i) and protein levels by immune-blotting (ii) (N = 5; t test, *P < 0.05; **P < 0.01; ***P < 0.001). c Transcriptional levels of SHH (i), PTCH1 (ii) in Raji cells transfected with pcDNA3-PN1 plasmid (2 μg) or treated with a SMO inhibitor cyclopamine (20 μM) or both for 24 h (N = 6; one-way ANOVA; *P < 0.05; **P < 0.01; ***P < 0.001). d Immune-blotting of SHH-signaling pathway molecules and PN-1 from Raji cells treated as indicated above. e Cell proliferation (i) was analyzed by CCK-8 proliferation assay after 48 and 72 h culture of cells treated with PN1 transfection (2 μg) or cyclopamine (20 μM); apoptosis (ii) was determined by flow cytometry via Annexin-PI staining at 24 h as indicated above (N = 4; one-way ANOVA *P < 0.05; **P < 0.01; ***P < 0.001). f A20 cells (2 × 10⁶) were treated with mouse PN-1 recombinant protein at 50 or 100 ng/ml and mRNA transcripts SHH (i), GLI1 (ii), and PN1(iii) were measured by q-RT-PCR (N = 3; one-way ANOVA *P < 0.05; ***P < 0.001). Immune-blotting of PN-1 protein was performed using A20 cell conditioned medium (iv); g real-time PCR (i) for PN1, SHH, and GLI1 in A20 xenografts with or without PN-1 (10 μM) (N = 5; t test, **P < 0.01; ***P < 0.001); A20 xenografts with or without PN-1 (10 μM) were blotted via immune blotting (ii). h immune-histochemistry (brown) for SHH-signaling cascades and PN-1 in A20 xenograft tumor. DAB-stained for the angiogenesis marker CD31 (brown). Blue stain is hemotoxylin nuclear staining; i (i) Subcutaneous tumor volumes from NOD/SCID mice implanted with Raji cells (5 × 10⁶) mixed with PBS or Matrigel with or without SB3CT (7.5 μM) were measured and plotted (N = 3; t test *P < 0.05). (ii) Immune blots of PN-1, SHH, and GLI1 in Raji Nod/SCID xenografts with or without SB3CT (7.5 μM). j DAB staining of PN-1 and SHH in human lymphoid tissues. Measurement of staining intensity compared with lymph nodes from normal (N = 10), lymph node reactive hyperplasia (N = 13), or DLBCL-infiltrated lymph nodes (N = 24). One-way ANOVA performed. Correlation between PN-1 and SHH calculated using Spearman r value

