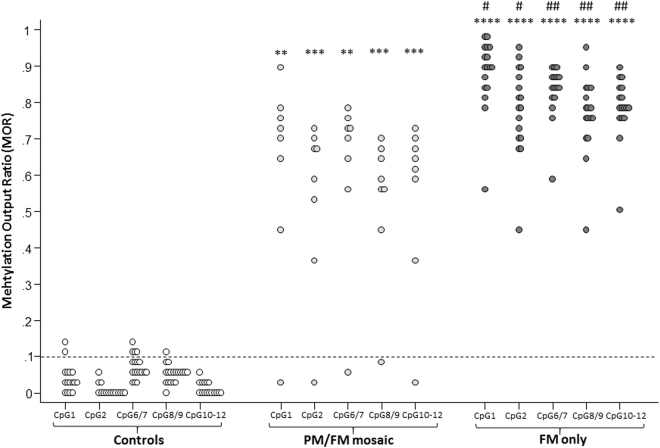
Figure 1.
Inter-group comparison of FREE2 DNA methylation in buccal epithelial cells. Controls: control participants with normal FMR1 CGG size (<45 CGG); PM/FM: participants with FMR1 PM/FM (premutation/full mutation) CGG size mosaicism; FM: participants with FMR1 FM CGG expansion only. Note: the parallel black broken lines at 0.1 MOR represents the analytical sensitivity of the EpiTYPER assay, as previously defined4; ****p < 1.3 × 10⁻⁶ for the comparison between controls and participants with FM expansion (see Supplementary Table S5); ***p < 0.0005 for the comparison between controls and participants with PM/FM size mosaicism (see Supplementary Table S6); **p < 0.001 for the comparison between controls and participants with PM/FM size mosaicism (see Supplementary Table S6); ##p < 0.001 for the comparison between participants with PM/FM size mosaicism and participants with FM only (see Supplementary Table S3); #p < 0.005 for the comparison between participants with PM/FM size mosaicism and participants with FM only (see Supplementary Table S3).

