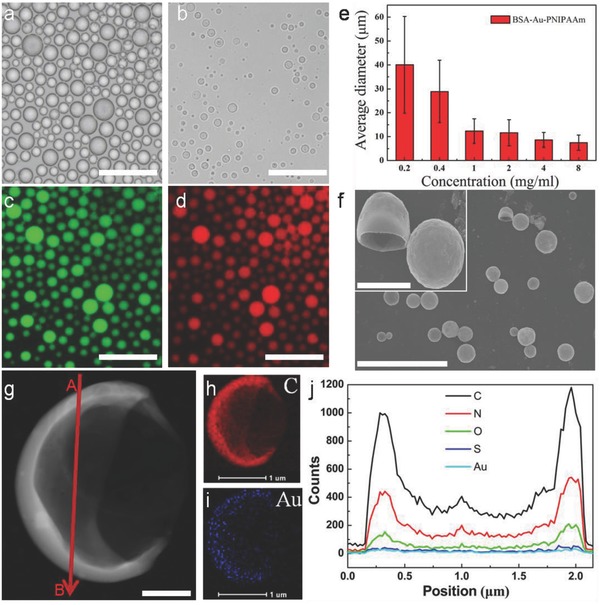
Figure 1.

Optical microscopy images of a) HPs‐Au in oil phase and b) after partial drying in air. c,d) Fluorescence microscopy images of HPs‐Au in water‐in‐oil solution. e) Plot showing mean size (bars) and standard deviation (lines on bars) of HPs‐Au dispersed in oil and prepared at different concentrations. f) SEM showing a hollow and stabilized structure. g) HRTEM showing continuous and robust HPs‐Au membranes. h,i) The C and Au elemental distribution. j) Energy dispersive spectroscopy (EDS) line profile analysis of C, N, O, S, and Au elemental distribution taken from A to B in panel (g). Scale bars in panels (a)–(d) are 50 µm; in panel (f) is 20 µm, the inset is 3 µm; in panel (g) is 500 nm; and in panels (h) and (i) are 1 µm, respectively.
