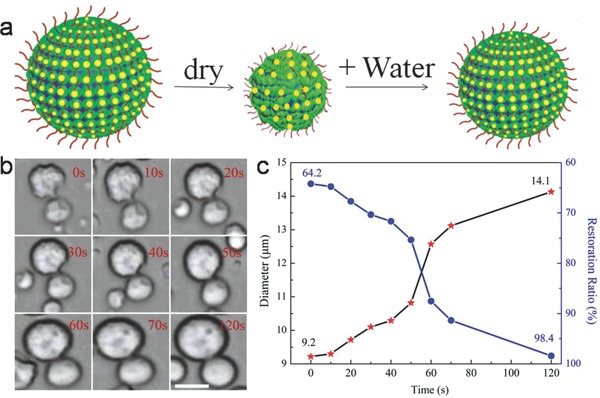
Figure 2.

a) Schematic illustration showing self‐rehydration behavior of HPs‐Au. b) The corresponding time‐dependent optical microscopy images of single HPs‐Au by adding water during 0–120 s; scale bar, 10 µm. c) The changes of diameter and restoration ratio during the process of self‐rehydration.
