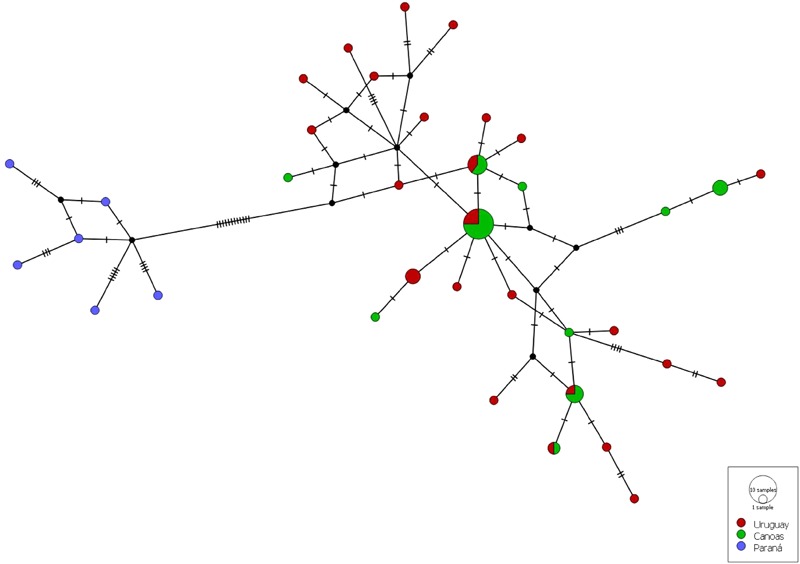
FIGURE 3.

Median-joining network of Steindachneridion scriptum, based on haplotypes of mtDNA control region. The colors indicate locality according to the legend, size of the circles illustrates the number of identical haplotypes, and small black circles, hypothetical ancestors or unsampled haplotypes. Hatch marks represent the number of mutations by which haplotypes differ.
