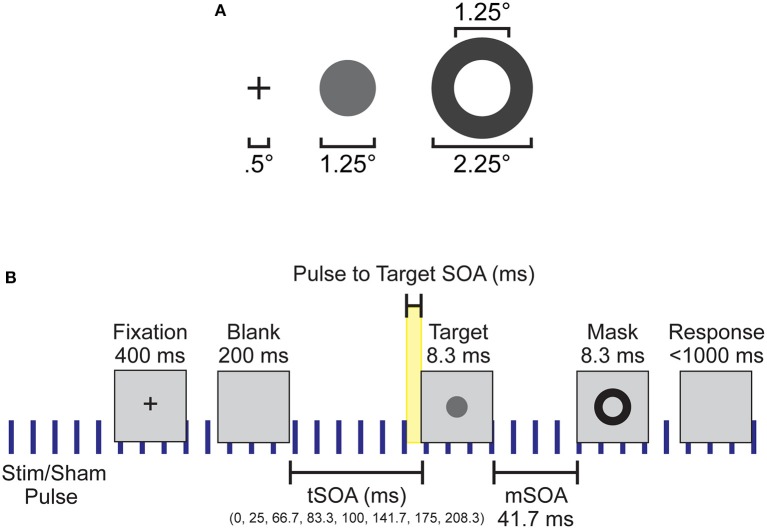
Figure 1.
Experimental setup and design. (A) Spatial dimensions of the stimuli, which were presented to subjects at the center of the screen. (B) Individual trial timeline with durations of each screen presentation. Blue vertical lines indicate the continuous application of the 10 Hz sham or otCS stimulation pulse throughout the task. Highlighted yellow area was the time range between the preceding stimulation (sham or otCS) pulse and the onset of the target which was used to subdivide the trials into 10 ms bins.

