Figure 5.

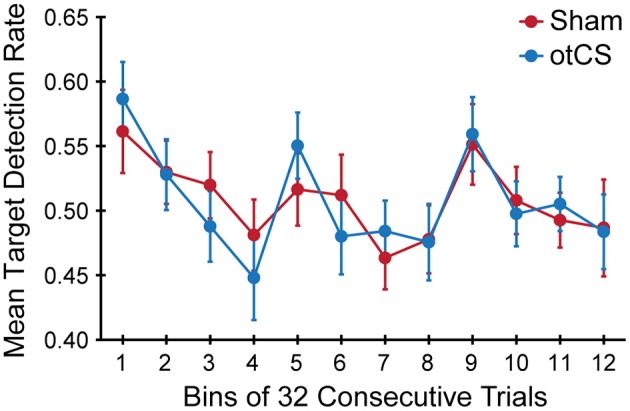
Mean target detection rates rate in each bin of 32 consecutive trials across the three experimental blocks during the sham and otCS stimulation conditions. Error bars indicate the SE.

Mean target detection rates rate in each bin of 32 consecutive trials across the three experimental blocks during the sham and otCS stimulation conditions. Error bars indicate the SE.