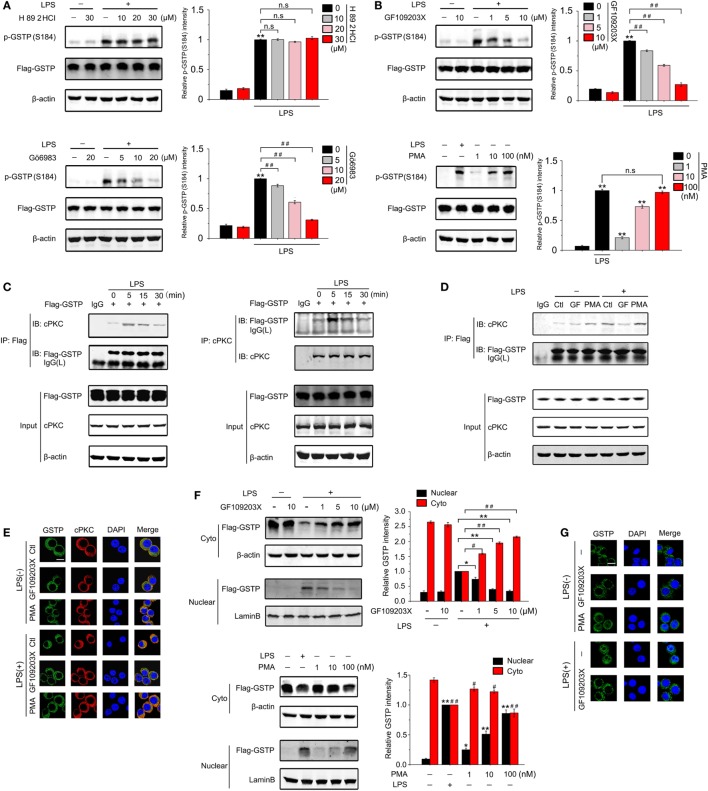
Figure 6.
Ser184 of glutathione S-transferase Pi (GSTP) is phosphorylated by classic protein kinase C (cPKC) under lypopolysaccharide (LPS) stimulation. (A,B) RAW264.7 cells were transfected with Flag-GSTP, followed by pretreatment with or without H 89 2HCl, Gö6983, or GF109203X for 2 h, and then stimulated with LPS (500 ng/ml) or phorbol-12-myristate-13-acetate (PMA) for 30 min. Western blot analysis was performed by using anti-p-GSTP (S184) antibody. (C) RAW264.7 cells were transfected with Flag-GSTP. After 36 h, cells were incubated with LPS (500 ng/ml) for 0, 5, 15, or 30 min. Cell lysates were immunoprecipitated with anti-Flag antibody(left) or anti-cPKC (right) and then were immunoblot analyzed with anti-cPKC and anti-Flag antibodies. Whole cell lysates were subjected to immunoblotting with anti-Flag, anti-cPKC and anti-β-actin antibodies. (D) RAW264.7 cells were transfected with Flag-GSTP and pre-treated with or without GF109203X (10 µM) for 2 h, followed by treatment of PMA (100 nM), LPS (500 ng/ml), or both for 5 min. Cell lysates were immunoprecipitated with anti-Flag antibody and then were immunoblot analyzed by using anti-Flag, anti-cPKC, and anti-β-actin antibodies. (E) RAW264.7 cells were pretreated with or without GF109203X (10 µM) for 2 h, and then were stimulated with LPS (500 ng/ml), PMA (100 nM), or both for 5 min. After that, cells were incubated with rabbit anti-GSTP and mouse anti-cPKC antibodies, and then, were incubated with Alexa flour488-conjugated anti-rabbit (green) and Alexa flour555-conjugated anti-mouse (red) secondary antibodies. The nuclei were counterstained with DAPI (blue). The complex of GSTP and cPKC was observed by confocal laser microscopy. Scale bar: 10 µm. (F) RAW264.7 cells were transfected with Flag-GSTP, followed by pretreatment with or without indicated concentrations of GF109203X for 2 h and stimulation with LPS (500 ng/ml) (upper) or PMA (100 nM) (lower) for 6 h. Nuclear and cytoplasmic fractions were analyzed by Western blot using anti-Flag antibody (upper). (G) RAW264.7 cells were pretreated with or without GF109203X (10 µM) for 2 h followed by stimulating with LPS (500 ng/ml) or PMA (100 nM) for 6 h, and then microscopic images were captured to show GSTP (green) and DAPI (blue) in cells. Scale bar: 10 µm. The blots were representative of three independent experiments. Data information: in (A,B), data are presented as mean ± SD. ##P<0.01; n.s., not significant (P > 0.05), versus corresponding LPS-treated group by unpaired Student’s t-test. In (F), *P<0.05; **P<0.01 versus corresponding LPS-treated nuclear group by unpaired Student’s t-test. #P<0.05; ##P<0.01 versus corresponding LPS-treated cytoplasmic group by unpaired Student’s t-test (lower). *P<0.05; **P<0.01 versus untreated nuclear group by unpaired Student’s t-test. #P<0.05; ##P<0.01 versus untreated cytoplasmic group by unpaired Student’s t-test.

