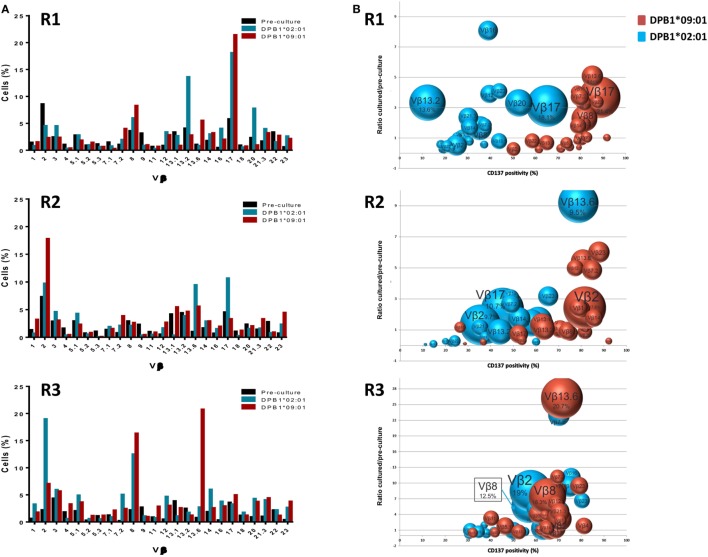
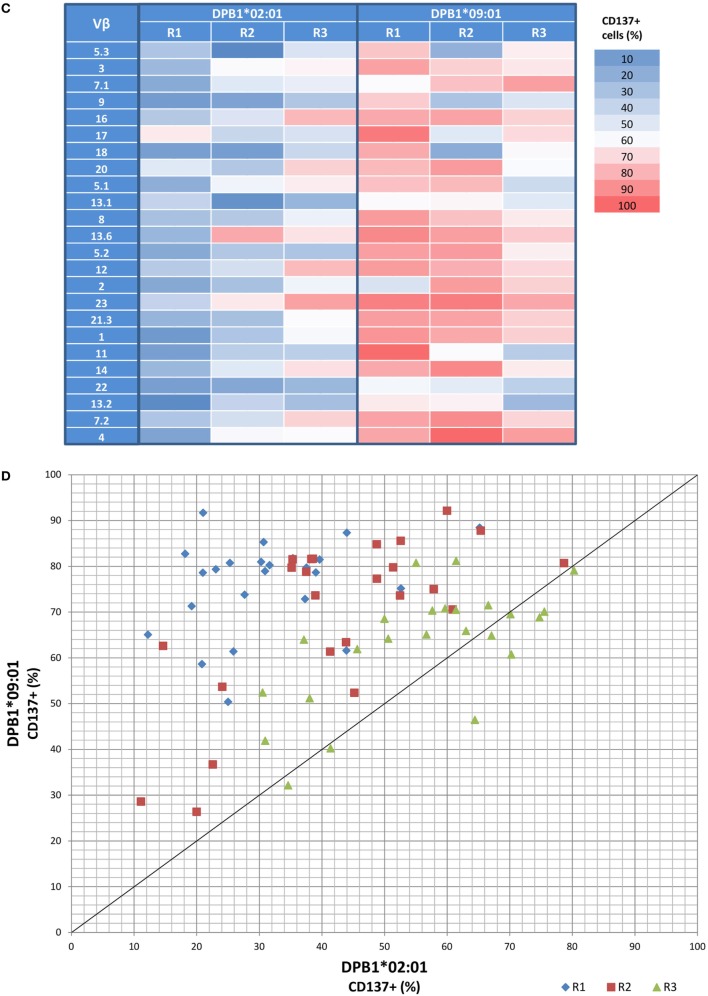
Figure 2.
Alloresponses against both HLA-DPB1*02:01 and DPB1*09:01 originate from a varied repertoire at the Vβ level, but with stronger responsiveness against the latter. TCR-Vβ analysis of 24 Vβ specificities was performed by flow cytometry in CD4+ T cells from three self-DPB1*04:01,*04:02 responders (R) after 2 weeks of culture with HeLa cells expressing DPB1*02:01 or DPB1*09:01, followed by overnight reincubation with HeLa cells expressing the original alloantigen. (A) Percentage of cells pre-culture and in the CD137+ cultured fractions after restimulation expressing each of the targeted Vβ families against each alloantigen. (B) Enrichment in the CD137+ cultured fraction vs. pre-culture levels (y axis) of each of the Vβ specificities was quantified and plotted against CD137 positivity for all cells expressing that Vβ family after restimulation (x axis). The size of each circle represents the share (% cells positive) of each Vβ specificity in the CD137+ T cell receptor repertoire. Vβ family dynamics against DPB1*02:01 (blue circles) and DPB1*09:01 (red circles) are shown for each responder. (C) Heat map showing CD137 positivity levels among all cells expressing each Vβ specificity for each of the responders against the two DPB1 alleles. Shown in red are strongly responding Vβ specificities (>60% CD137+ cells after restimulation among all CD4+ cells expressing that specificity). (D) Plot showing the response (CD137 levels) of each of the targeted Vβ specificities against DPB1*02:01 (x axis) and DPB1*09:01 (y axis) for each of the three responders. Each dot represents one targeted Vβ specificity for each of the responders. The majority of the Vβ specificities respond with higher CD137 levels against DPB1*09:01 than to DPB1*02:01.


