Figure 5.
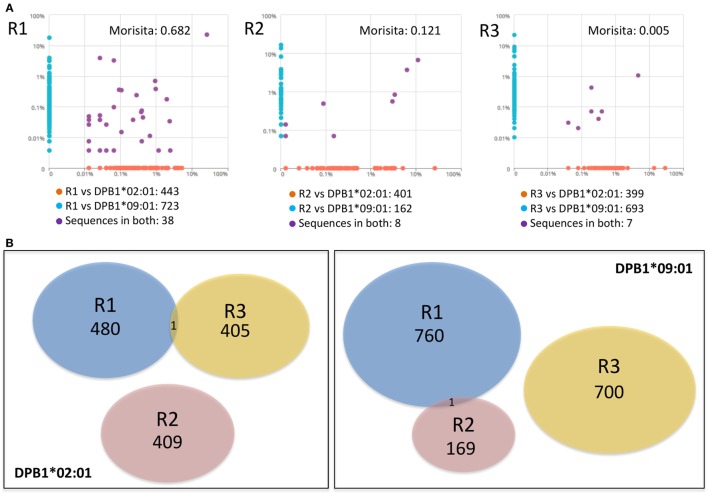
Responses against DPB1*02:01 and DPB1*09:01 alleles are highly divergent and individualized. The sharing of TCRB-CDR3 amino acid sequences among CD4+CD137+ cells responding against DPB1 alleles was compared. (A) Pairwise scatter plots showing the frequency and sharing of clones against each allele in each of the three responders (R). Within each responding individual, there was a low sharing of clones (purple dots) between their responses against DPB1*09:01 (y axis) and DPB1*02:01 (x axis). Morisita’s indexes for each pairwise T cell receptor clone set comparison are shown. (B) Venn diagrams show the sharing of clones across individuals against DPB1*02:01 (left panel) and DPB1*09:01 (right panel). The number of unique sequences in each clone set is depicted. Only one DPB1-alloreactive clone was shared across individuals for each allele.

