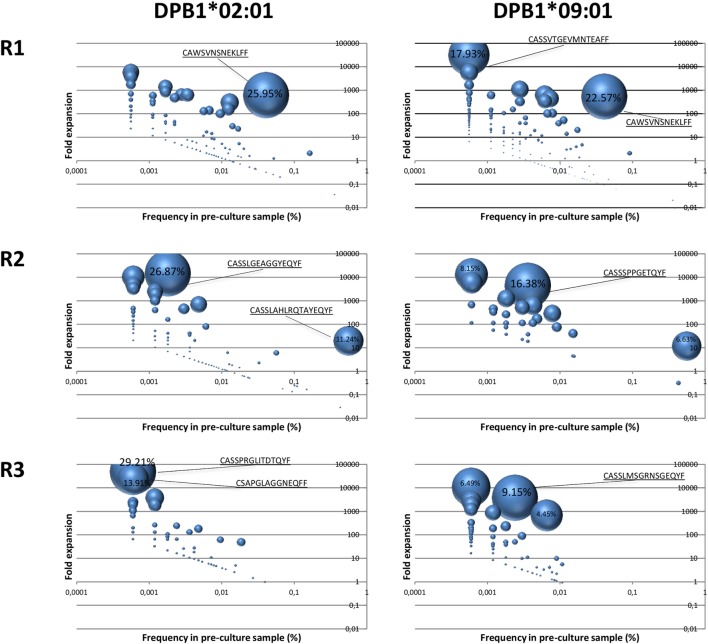
Figure 6.
Expansion of DPB1-specific alloreactive clones detected in pre-culture samples. Fold expansion among alloreactive T cell clones present in the cultured samples and that could be detected in the pre-culture samples for each responder (R) was quantified and plotted (y axis) against their frequency in the pre-culture sample (x axis). The size of the circle represents the share of each clone in the total cultured set. Highest values (%) are indicated for each sample. Left panels, clones responding against DPB1*02:01; right panels, clones responding against DPB1*09:01. As shown in Figure 7A (purple dots), 177, 146, and 92 clones against DPB1*02:01, and 249, 43, and 112 clones against DPB1*09:01 were detected in both the cultured and the pre-culture samples for R1, R2, and R3, respectively.

