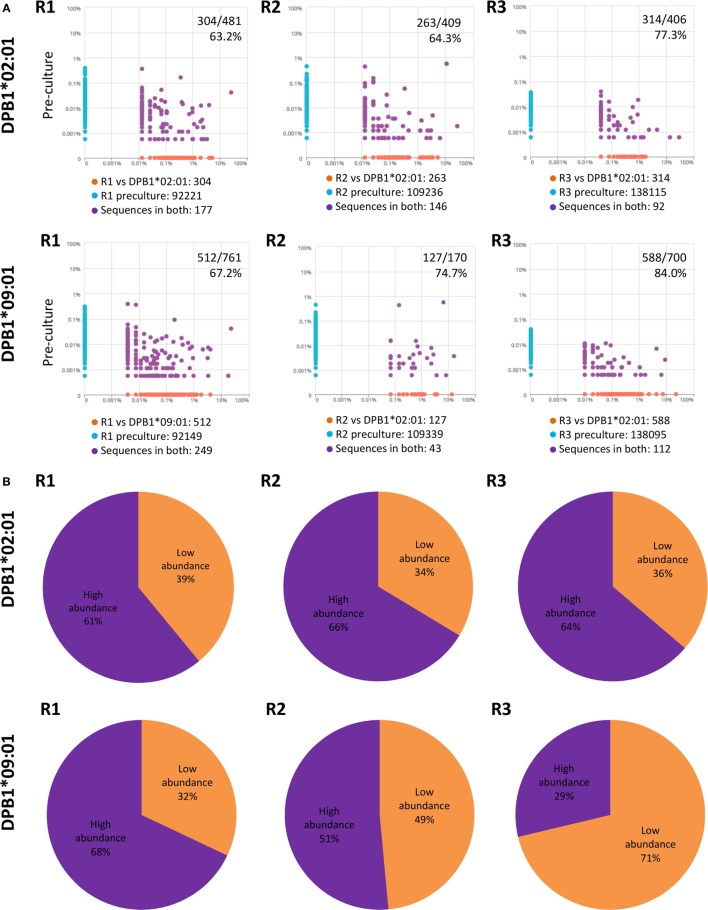
Figure 7.
Low abundance pre-culture T cell clones represent a substantial part of the alloreactive clones elicited against HLA-DPB1 molecules with higher share against DPB1*09:01. (A) Clone (CDR3 amino acid) pairwise scatter plots between pre-culture repertoires and CD4+CD137+ cells responding against DPB1*02:01 (top panels) and DPB1*09:01 (bottom panels) are shown for each responder (R). Low-abundance DPB1-alloreactive clones (orange dots in the pairwise scatter plots) were defined as those present in the cultured sample (x axis) and not detected in the respective pre-culture repertoire (y axis). The number and percentage of low abundance clones relative to the total number of clones detected in the cultured sample are shown. (B) The share (cumulative frequency) of low abundance clones was quantified for clones responding against DPB1*02:01 (top panels) or DPB1*09:01 (bottom panels) in each subject. The average cumulative frequency for low-abundance clones against DPB1*02:01 and DPB1*09:01 was 36.3 and 50.6%, respectively.

