
Figure 3.
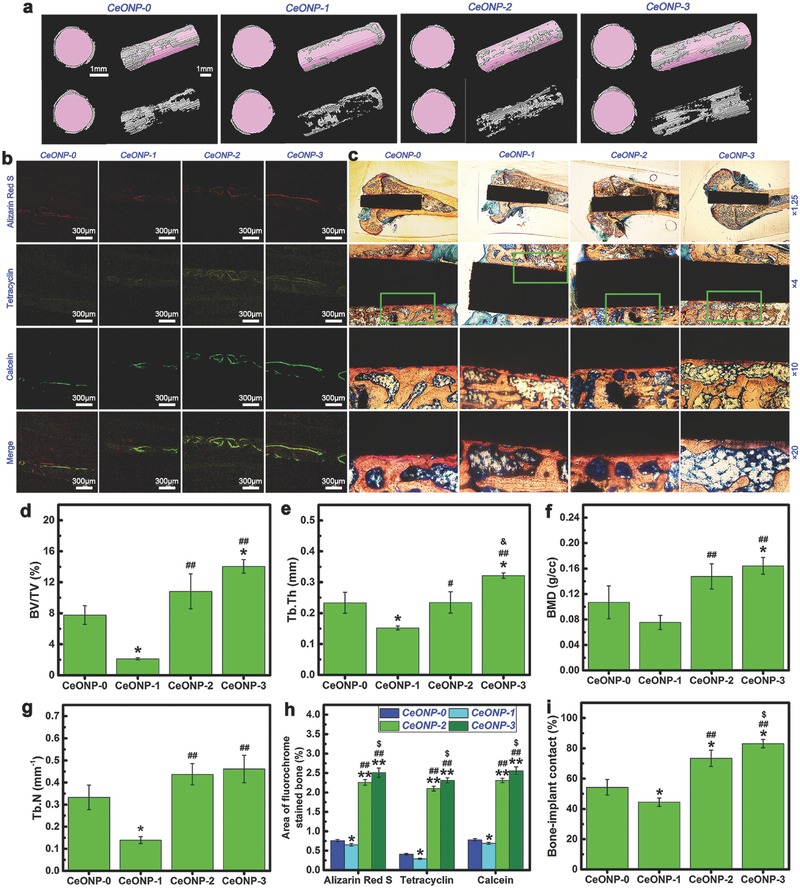
Micro‐CT images of reconstructed 3D models of surrounding bones in transverse and longitudinal views, with or without implants a), accompanied by the corresponding quantitative analysis results of BV/TV d), Tb.Th e), BMD f), and Tb.N g). Sequential fluorescent labeling observation b), accompanied by the corresponding analysis results h) of the area of bone stained with the three fluorochromes. (Note: Red labeling, Alizarin Red S, week 2; yellow labeling, tetracycline, week 4; green labeling, calcein, week 6; *P < 0.05, **P < 0.01 versus CeONP‐0; ## P < 0.01 versus CeONP‐1; $ P < 0.05 versus CeONP‐2.) Histological observation c) of the CeONP‐0, CeONP‐1, CeONP‐2, and CeONP‐3 sections stained with Van Gieson's picrofuchsin, accompanied by the corresponding analysis results i) of bone‐implant contact from the histomorphometric measurement at ×10 magnification. (Note: *P < 0.05 versus CeONP‐0; ## P < 0.01 versus CeONP‐1; $ P < 0.05 versus CeONP‐2.)