
Figure 7.
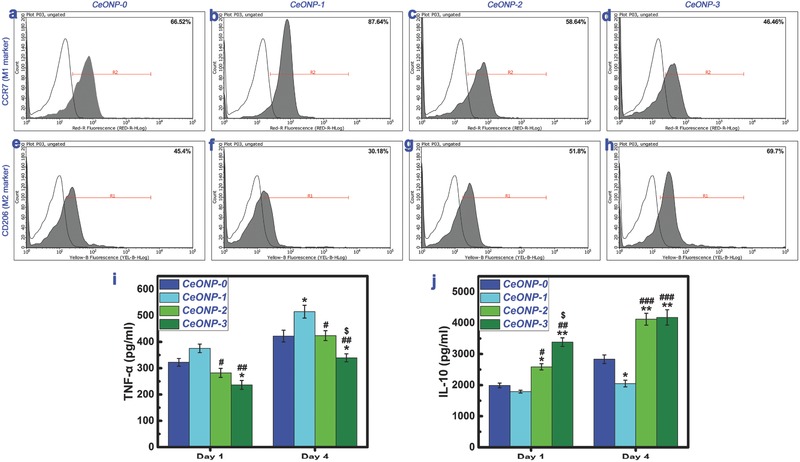
Expression of cell surface markers on RAW264.7 macrophages determined by flow cytometry, showing the percentages of M1 phenotype (CCR7, a–d) and M2 phenotype (CD206, e–h). Production of cytokines TNF‐α i) and IL‐10 j) secreted by RAW264.7 macrophages cultured on various samples determined by ELISA. Note: *P < 0.05, **P < 0.01 versus CeONP‐0; # P < 0.05, ## P < 0.01, ### P < 0.001 versus CeONP‐1; $ P < 0.05 versus CeONP‐2.