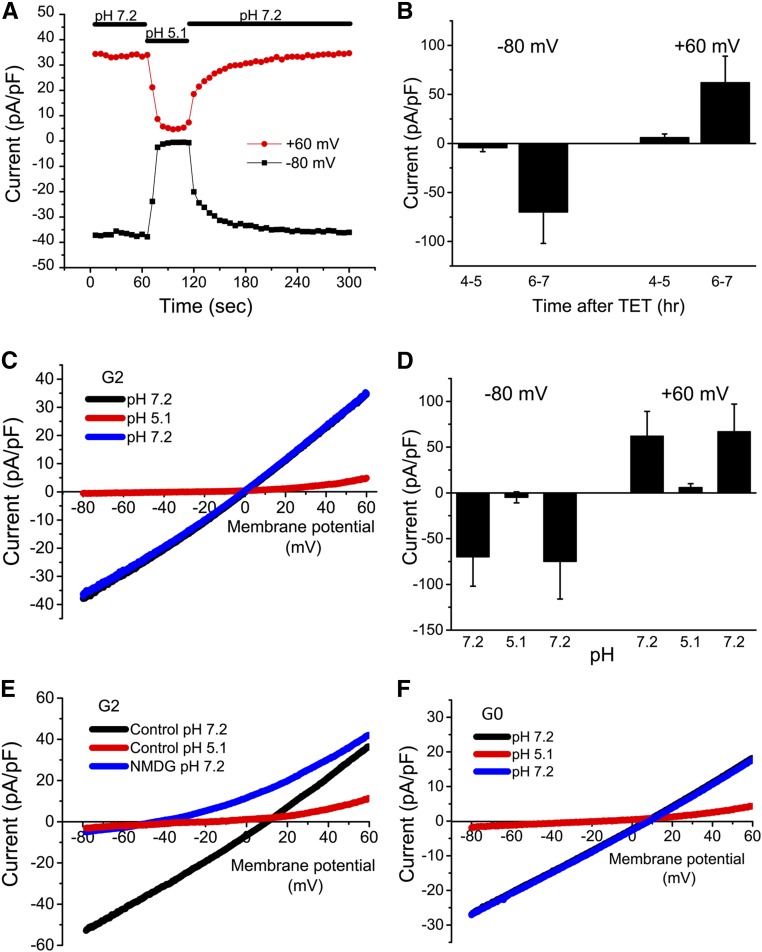
Figure 6.
APOL1 expression is associated with the appearance of cation-selective and pH-sensitive whole-cell membrane currents. (A) Whole-cell membrane currents were recorded in an APOL1-G2–expressing 293 cell 6 hours after addition of tetracycline (1 µg/ml). Voltage ramps were applied every 6 seconds and the outward current at +60 mV (red) and inward current at −80 mV (black) during each ramp are plotted as a function of time after rupture of the patch for whole-cell recording. At the time indicated by the horizontal bar (top), the bath solution was changed from pH 7.2 to pH 5.1 and subsequently returned to pH 7.2. (B) Summary of inward (−80) and outward (+60) current amplitudes recorded at pH 7.2 at 4–5 or 6–7 hours after tetracycline induction. Values are mean±SD, n=3–5. (C) Representative current-voltage relationships (I-V) of the cell shown in (A) obtained in bath solution of the indicated pH. Note that the blue and black traces are virtually superimposable. (D) Summary of inward (−80) and outward (+60) current amplitudes at the different pH values; mean±SD, n=3. (E) Representative I-Vs showing the inhibition by reduced pH and the shift in reversal potential upon replacement of extracellular Na+ with NMDG (n=3). (F) Experiments were performed as in (A). The I-Vs show inhibition by reduced pH in APOL1-G0–expressing 293 cells (representative of n=3). Note that the blue and black traces are superimposed. G0, APOL1-G0; G2, APOL1-G2; TET, tetracycline.

