Figure 2.
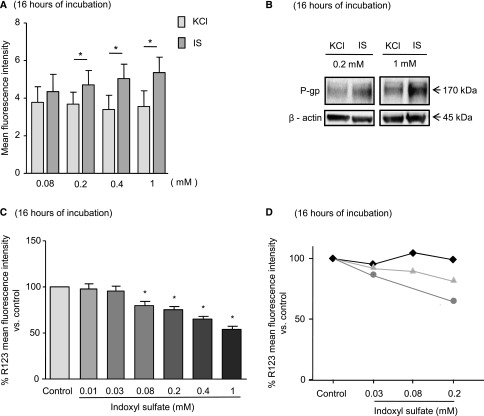
IS increased the expression and activity of P-gp in HepG2 cells and the activity of P-gp in human primary hepatocytes. The expression of P-gp was evaluated in HepG2 by (A) flow cytometry and (B) Western blot. (C and D) The transporter efflux activity was evaluated by using its fluorescent substrate R123 (5 μM) in (C) HepG2 or (D) three samples of human primary hepatocytes. (A and C) Data are expressed as mean±SEM of six independent experiments. *P<0.05.

