Figure 7.
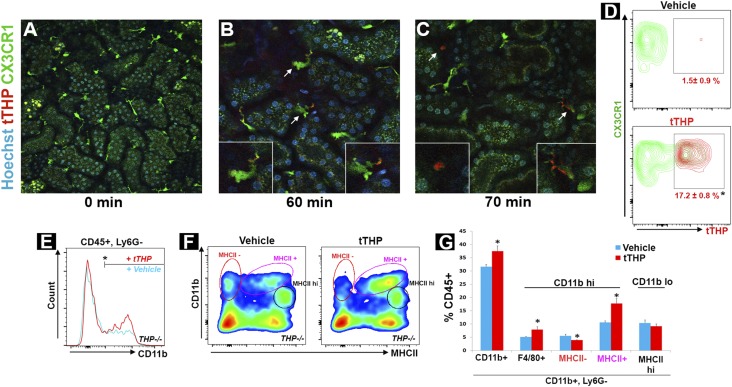
Treatment with exogenous tTHP increases the number of mononuclear phagocytes. (A–C) show intravital imaging of the kidney cortex in CX3CR1-GFP+ mice, showing resident dendritic and macrophage cells labeled in green, (A) before (20× objective) and (B and C) after (60× objective) injection of tTHP labeled with Alexa 568 in red. THP was observed in the peritubular circulation and interstitium as early as 30 minutes postinjection (data not shown), and is taken up by dendritic cells and macrophages starting at 60 minutes. Insets show enlargement of the cells indicated by the arrows. Macrophages have a characteristic shape (left inset in C) and a high degree of mobility (see Supplemental Video). (D) Representative flow cytometry contour plot showing the distribution of tTHP uptake in CX3CR-GFP+ cells 1 hour after injection compared with vehicle (n=4 per group). The mean±SEM are shown for each group, and the asterisk denotes statistical significance between the groups, P<0.05. (E) Representative histogram showing the distribution of CD11b within CD45+Ly6G− gated cells, in kidneys from THP−/− treated with THP or vehicle as described in the Concise Methods. (F) Scatter plots of these cells gated for according to CD11b and MHCII intensity, and (G) the corresponding quantitation of the gated cells as percentage of CD45+ cells. Asterisks represent a statistically significant difference between groups (n=5 per group, P<0.05). hi, high; lo, low.

