Figure 8.
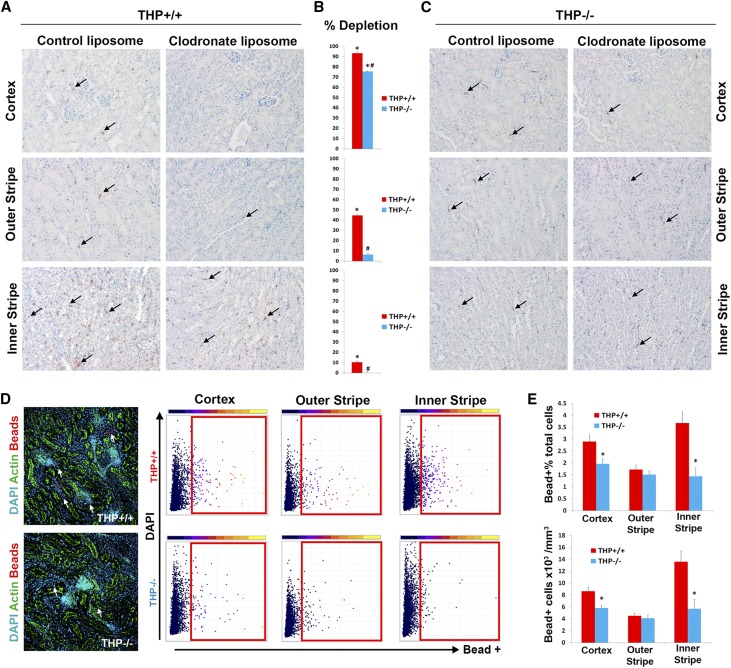
Impaired phagocytic activity of renal MPCs in vivo with THP deficiency. (A and C) F4/80 immunohistochemistry (arrows pointing to F4/80+ cells) of representative kidney sections from THP+/+ or THP−/− mice (n=5 per group/treatment) treated with empty liposomes or with clodronate liposomes, respectively. (B) Bar graphs showing the percentage of F4/80 macrophage depletion with clodronate versus empty liposome of each mouse genotype in different areas of the kidney. *Statistical significance for clodronate versus control liposome; # denotes significance between THP+/+ and THP−/− (P<0.05). (D) (left) Representative z projections of image stacks spanning 50 µm, imaged with spectral confocal microscopy (20× objective), from kidney sections of THP+/+ and THP−/− mice, 90 minutes after intravenous injections of fluorescent beads. 3D tissue cytometry scatter plots are shown from each area of the kidney, with gates indicating bead+ cells. (E) Quantitation of bead+ cell abundance and density. Asterisk denotes statistical significance between the two groups (n=5 per group).

